Immigrants from Uzbekistan vs Luxembourger Median Male Earnings
COMPARE
Immigrants from Uzbekistan
Luxembourger
Median Male Earnings
Median Male Earnings Comparison
Immigrants from Uzbekistan
Luxembourgers
$57,941
MEDIAN MALE EARNINGS
96.7/ 100
METRIC RATING
108th/ 347
METRIC RANK
$56,300
MEDIAN MALE EARNINGS
85.5/ 100
METRIC RATING
140th/ 347
METRIC RANK
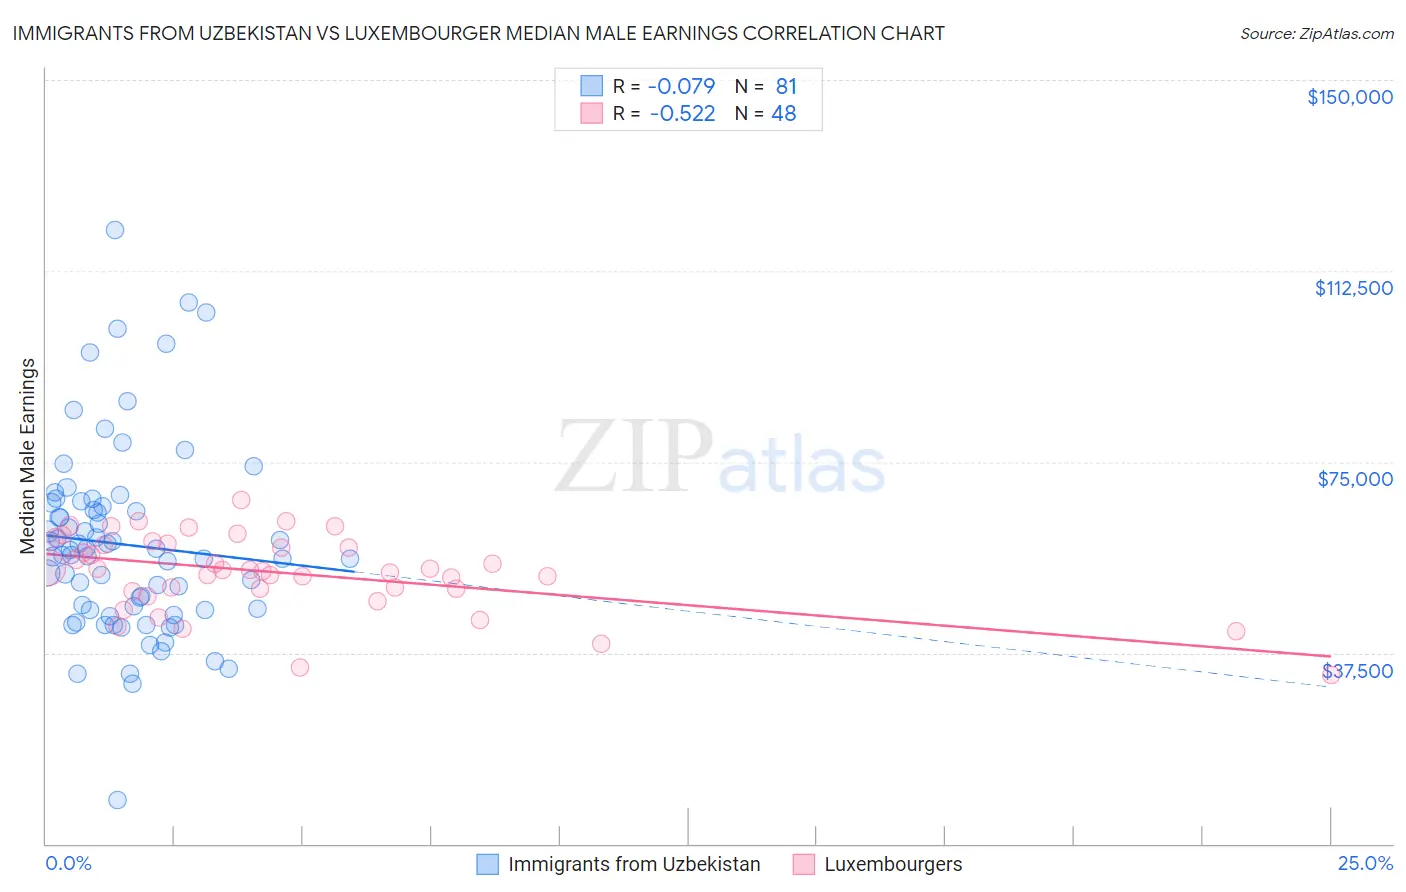
Immigrants from Uzbekistan vs Luxembourger Median Male Earnings Correlation Chart
The statistical analysis conducted on geographies consisting of 118,770,599 people shows a slight negative correlation between the proportion of Immigrants from Uzbekistan and median male earnings in the United States with a correlation coefficient (R) of -0.079 and weighted average of $57,941. Similarly, the statistical analysis conducted on geographies consisting of 144,673,100 people shows a substantial negative correlation between the proportion of Luxembourgers and median male earnings in the United States with a correlation coefficient (R) of -0.522 and weighted average of $56,300, a difference of 2.9%.
Median Male Earnings Correlation Summary
| Measurement | Immigrants from Uzbekistan | Luxembourger |
| Minimum | $8,518 | $33,125 |
| Maximum | $120,441 | $67,500 |
| Range | $111,923 | $34,375 |
| Mean | $58,740 | $53,182 |
| Median | $56,668 | $53,767 |
| Interquartile 25% (IQ1) | $45,939 | $49,758 |
| Interquartile 75% (IQ3) | $66,644 | $58,691 |
| Interquartile Range (IQR) | $20,705 | $8,933 |
| Standard Deviation (Sample) | $18,622 | $7,604 |
| Standard Deviation (Population) | $18,506 | $7,525 |
Similar Demographics by Median Male Earnings
Demographics Similar to Immigrants from Uzbekistan by Median Male Earnings
In terms of median male earnings, the demographic groups most similar to Immigrants from Uzbekistan are Serbian ($57,975, a difference of 0.060%), British ($57,890, a difference of 0.090%), Immigrants from Northern Africa ($58,008, a difference of 0.12%), Palestinian ($57,778, a difference of 0.28%), and Armenian ($58,134, a difference of 0.33%).
| Demographics | Rating | Rank | Median Male Earnings |
| Immigrants | Brazil | 97.7 /100 | #101 | Exceptional $58,324 |
| Syrians | 97.4 /100 | #102 | Exceptional $58,187 |
| Poles | 97.3 /100 | #103 | Exceptional $58,139 |
| Armenians | 97.3 /100 | #104 | Exceptional $58,134 |
| Immigrants | Western Asia | 97.3 /100 | #105 | Exceptional $58,131 |
| Immigrants | Northern Africa | 96.9 /100 | #106 | Exceptional $58,008 |
| Serbians | 96.8 /100 | #107 | Exceptional $57,975 |
| Immigrants | Uzbekistan | 96.7 /100 | #108 | Exceptional $57,941 |
| British | 96.5 /100 | #109 | Exceptional $57,890 |
| Palestinians | 96.2 /100 | #110 | Exceptional $57,778 |
| Europeans | 95.6 /100 | #111 | Exceptional $57,637 |
| Immigrants | Afghanistan | 95.4 /100 | #112 | Exceptional $57,582 |
| Carpatho Rusyns | 95.3 /100 | #113 | Exceptional $57,572 |
| Immigrants | Kuwait | 95.3 /100 | #114 | Exceptional $57,562 |
| Swedes | 94.8 /100 | #115 | Exceptional $57,445 |
Demographics Similar to Luxembourgers by Median Male Earnings
In terms of median male earnings, the demographic groups most similar to Luxembourgers are Zimbabwean ($56,302, a difference of 0.0%), Slovak ($56,306, a difference of 0.010%), Danish ($56,246, a difference of 0.10%), Ethiopian ($56,243, a difference of 0.10%), and Slavic ($56,390, a difference of 0.16%).
| Demographics | Rating | Rank | Median Male Earnings |
| Immigrants | Germany | 88.2 /100 | #133 | Excellent $56,542 |
| Moroccans | 87.7 /100 | #134 | Excellent $56,499 |
| Irish | 87.4 /100 | #135 | Excellent $56,464 |
| Immigrants | Saudi Arabia | 87.2 /100 | #136 | Excellent $56,452 |
| Slavs | 86.5 /100 | #137 | Excellent $56,390 |
| Slovaks | 85.5 /100 | #138 | Excellent $56,306 |
| Zimbabweans | 85.5 /100 | #139 | Excellent $56,302 |
| Luxembourgers | 85.5 /100 | #140 | Excellent $56,300 |
| Danes | 84.8 /100 | #141 | Excellent $56,246 |
| Ethiopians | 84.8 /100 | #142 | Excellent $56,243 |
| Sri Lankans | 83.4 /100 | #143 | Excellent $56,136 |
| Immigrants | Uganda | 82.4 /100 | #144 | Excellent $56,064 |
| Norwegians | 80.9 /100 | #145 | Excellent $55,965 |
| Immigrants | Chile | 80.7 /100 | #146 | Excellent $55,954 |
| Immigrants | Philippines | 78.4 /100 | #147 | Good $55,809 |