Immigrants from Uzbekistan vs Moroccan Householder Income Ages 45 - 64 years
COMPARE
Immigrants from Uzbekistan
Moroccan
Householder Income Ages 45 - 64 years
Householder Income Ages 45 - 64 years Comparison
Immigrants from Uzbekistan
Moroccans
$100,523
HOUSEHOLDER INCOME AGES 45 - 64 YEARS
52.5/ 100
METRIC RATING
172nd/ 347
METRIC RANK
$100,138
HOUSEHOLDER INCOME AGES 45 - 64 YEARS
47.7/ 100
METRIC RATING
177th/ 347
METRIC RANK
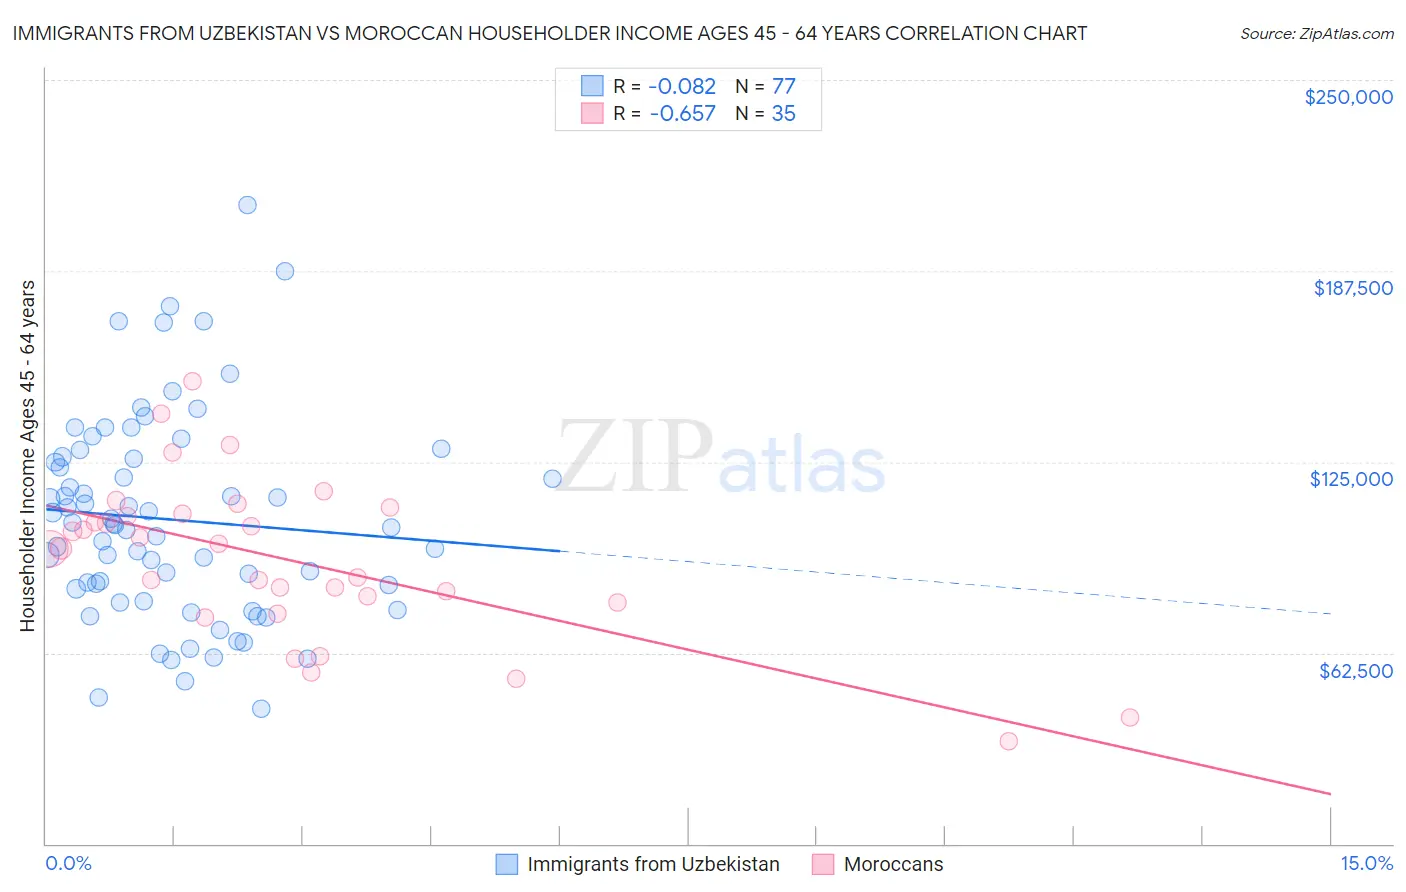
Immigrants from Uzbekistan vs Moroccan Householder Income Ages 45 - 64 years Correlation Chart
The statistical analysis conducted on geographies consisting of 118,644,121 people shows a slight negative correlation between the proportion of Immigrants from Uzbekistan and household income with householder between the ages 45 and 64 in the United States with a correlation coefficient (R) of -0.082 and weighted average of $100,523. Similarly, the statistical analysis conducted on geographies consisting of 201,649,728 people shows a significant negative correlation between the proportion of Moroccans and household income with householder between the ages 45 and 64 in the United States with a correlation coefficient (R) of -0.657 and weighted average of $100,138, a difference of 0.38%.
Householder Income Ages 45 - 64 years Correlation Summary
| Measurement | Immigrants from Uzbekistan | Moroccan |
| Minimum | $44,028 | $33,750 |
| Maximum | $209,232 | $151,275 |
| Range | $165,204 | $117,525 |
| Mean | $106,089 | $92,917 |
| Median | $104,321 | $96,708 |
| Interquartile 25% (IQ1) | $81,393 | $79,167 |
| Interquartile 75% (IQ3) | $126,326 | $108,085 |
| Interquartile Range (IQR) | $44,934 | $28,918 |
| Standard Deviation (Sample) | $33,612 | $26,273 |
| Standard Deviation (Population) | $33,393 | $25,895 |
Demographics Similar to Immigrants from Uzbekistan and Moroccans by Householder Income Ages 45 - 64 years
In terms of householder income ages 45 - 64 years, the demographic groups most similar to Immigrants from Uzbekistan are Alsatian ($100,435, a difference of 0.090%), Welsh ($100,322, a difference of 0.20%), German ($100,224, a difference of 0.30%), South American ($100,837, a difference of 0.31%), and Immigrants from Costa Rica ($100,141, a difference of 0.38%). Similarly, the demographic groups most similar to Moroccans are Immigrants from Costa Rica ($100,141, a difference of 0.0%), Immigrants from Cameroon ($100,084, a difference of 0.050%), Belgian ($100,060, a difference of 0.080%), German ($100,224, a difference of 0.090%), and Aleut ($100,052, a difference of 0.090%).
| Demographics | Rating | Rank | Householder Income Ages 45 - 64 years |
| Immigrants | Morocco | 70.0 /100 | #164 | Good $102,015 |
| Immigrants | Albania | 69.4 /100 | #165 | Good $101,957 |
| Samoans | 65.3 /100 | #166 | Good $101,580 |
| Czechoslovakians | 63.0 /100 | #167 | Good $101,387 |
| South American Indians | 60.5 /100 | #168 | Good $101,171 |
| Guamanians/Chamorros | 60.5 /100 | #169 | Good $101,170 |
| Slovaks | 58.8 /100 | #170 | Average $101,029 |
| South Americans | 56.4 /100 | #171 | Average $100,837 |
| Immigrants | Uzbekistan | 52.5 /100 | #172 | Average $100,523 |
| Alsatians | 51.4 /100 | #173 | Average $100,435 |
| Welsh | 50.0 /100 | #174 | Average $100,322 |
| Germans | 48.8 /100 | #175 | Average $100,224 |
| Immigrants | Costa Rica | 47.7 /100 | #176 | Average $100,141 |
| Moroccans | 47.7 /100 | #177 | Average $100,138 |
| Immigrants | Cameroon | 47.0 /100 | #178 | Average $100,084 |
| Belgians | 46.7 /100 | #179 | Average $100,060 |
| Aleuts | 46.6 /100 | #180 | Average $100,052 |
| Immigrants | Immigrants | 45.3 /100 | #181 | Average $99,943 |
| Finns | 44.8 /100 | #182 | Average $99,904 |
| Spaniards | 44.6 /100 | #183 | Average $99,889 |
| French | 43.8 /100 | #184 | Average $99,824 |