Immigrants from Uzbekistan vs Comanche Householder Income Ages 45 - 64 years
COMPARE
Immigrants from Uzbekistan
Comanche
Householder Income Ages 45 - 64 years
Householder Income Ages 45 - 64 years Comparison
Immigrants from Uzbekistan
Comanche
$100,523
HOUSEHOLDER INCOME AGES 45 - 64 YEARS
52.5/ 100
METRIC RATING
172nd/ 347
METRIC RANK
$85,787
HOUSEHOLDER INCOME AGES 45 - 64 YEARS
0.1/ 100
METRIC RATING
293rd/ 347
METRIC RANK
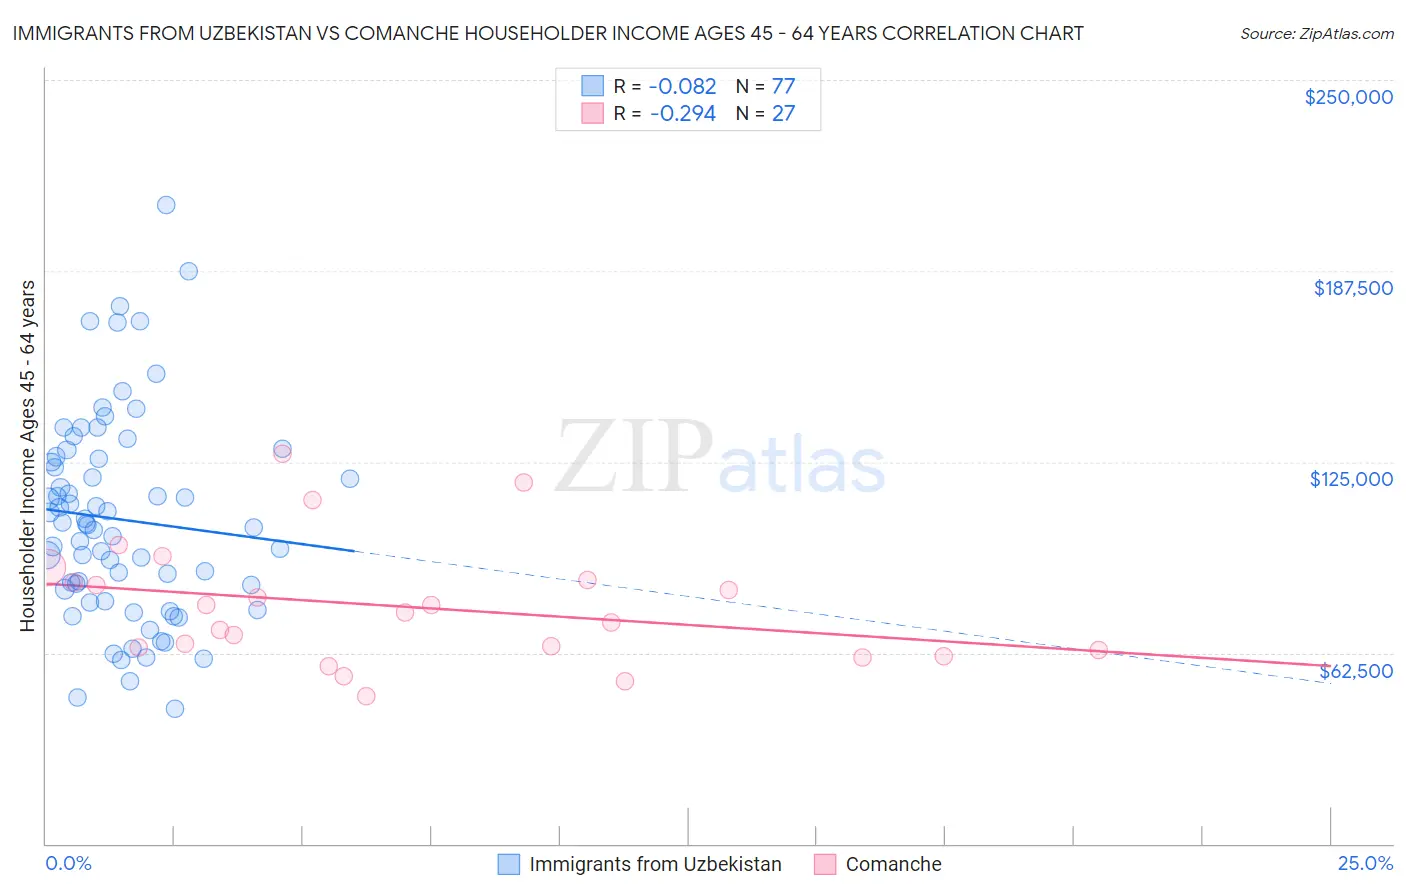
Immigrants from Uzbekistan vs Comanche Householder Income Ages 45 - 64 years Correlation Chart
The statistical analysis conducted on geographies consisting of 118,644,121 people shows a slight negative correlation between the proportion of Immigrants from Uzbekistan and household income with householder between the ages 45 and 64 in the United States with a correlation coefficient (R) of -0.082 and weighted average of $100,523. Similarly, the statistical analysis conducted on geographies consisting of 109,696,818 people shows a weak negative correlation between the proportion of Comanche and household income with householder between the ages 45 and 64 in the United States with a correlation coefficient (R) of -0.294 and weighted average of $85,787, a difference of 17.2%.
Householder Income Ages 45 - 64 years Correlation Summary
| Measurement | Immigrants from Uzbekistan | Comanche |
| Minimum | $44,028 | $48,474 |
| Maximum | $209,232 | $127,559 |
| Range | $165,204 | $79,085 |
| Mean | $106,089 | $77,729 |
| Median | $104,321 | $75,610 |
| Interquartile 25% (IQ1) | $81,393 | $63,523 |
| Interquartile 75% (IQ3) | $126,326 | $86,210 |
| Interquartile Range (IQR) | $44,934 | $22,687 |
| Standard Deviation (Sample) | $33,612 | $19,770 |
| Standard Deviation (Population) | $33,393 | $19,400 |
Similar Demographics by Householder Income Ages 45 - 64 years
Demographics Similar to Immigrants from Uzbekistan by Householder Income Ages 45 - 64 years
In terms of householder income ages 45 - 64 years, the demographic groups most similar to Immigrants from Uzbekistan are Alsatian ($100,435, a difference of 0.090%), Welsh ($100,322, a difference of 0.20%), German ($100,224, a difference of 0.30%), South American ($100,837, a difference of 0.31%), and Immigrants from Costa Rica ($100,141, a difference of 0.38%).
| Demographics | Rating | Rank | Householder Income Ages 45 - 64 years |
| Immigrants | Albania | 69.4 /100 | #165 | Good $101,957 |
| Samoans | 65.3 /100 | #166 | Good $101,580 |
| Czechoslovakians | 63.0 /100 | #167 | Good $101,387 |
| South American Indians | 60.5 /100 | #168 | Good $101,171 |
| Guamanians/Chamorros | 60.5 /100 | #169 | Good $101,170 |
| Slovaks | 58.8 /100 | #170 | Average $101,029 |
| South Americans | 56.4 /100 | #171 | Average $100,837 |
| Immigrants | Uzbekistan | 52.5 /100 | #172 | Average $100,523 |
| Alsatians | 51.4 /100 | #173 | Average $100,435 |
| Welsh | 50.0 /100 | #174 | Average $100,322 |
| Germans | 48.8 /100 | #175 | Average $100,224 |
| Immigrants | Costa Rica | 47.7 /100 | #176 | Average $100,141 |
| Moroccans | 47.7 /100 | #177 | Average $100,138 |
| Immigrants | Cameroon | 47.0 /100 | #178 | Average $100,084 |
| Belgians | 46.7 /100 | #179 | Average $100,060 |
Demographics Similar to Comanche by Householder Income Ages 45 - 64 years
In terms of householder income ages 45 - 64 years, the demographic groups most similar to Comanche are Immigrants from Central America ($85,965, a difference of 0.21%), Hispanic or Latino ($86,006, a difference of 0.25%), British West Indian ($85,571, a difference of 0.25%), Immigrants from Grenada ($85,552, a difference of 0.27%), and Cherokee ($86,125, a difference of 0.39%).
| Demographics | Rating | Rank | Householder Income Ages 45 - 64 years |
| Immigrants | Guatemala | 0.1 /100 | #286 | Tragic $86,573 |
| Bangladeshis | 0.1 /100 | #287 | Tragic $86,402 |
| Immigrants | St. Vincent and the Grenadines | 0.1 /100 | #288 | Tragic $86,394 |
| Cubans | 0.1 /100 | #289 | Tragic $86,301 |
| Cherokee | 0.1 /100 | #290 | Tragic $86,125 |
| Hispanics or Latinos | 0.1 /100 | #291 | Tragic $86,006 |
| Immigrants | Central America | 0.1 /100 | #292 | Tragic $85,965 |
| Comanche | 0.1 /100 | #293 | Tragic $85,787 |
| British West Indians | 0.1 /100 | #294 | Tragic $85,571 |
| Immigrants | Grenada | 0.1 /100 | #295 | Tragic $85,552 |
| Immigrants | Zaire | 0.1 /100 | #296 | Tragic $85,207 |
| Fijians | 0.1 /100 | #297 | Tragic $85,187 |
| Africans | 0.0 /100 | #298 | Tragic $84,925 |
| Immigrants | Mexico | 0.0 /100 | #299 | Tragic $84,910 |
| Indonesians | 0.0 /100 | #300 | Tragic $84,890 |