Immigrants from Uruguay vs Ute Currently Married
COMPARE
Immigrants from Uruguay
Ute
Currently Married
Currently Married Comparison
Immigrants from Uruguay
Ute
45.0%
CURRENTLY MARRIED
2.0/ 100
METRIC RATING
228th/ 347
METRIC RANK
43.9%
CURRENTLY MARRIED
0.2/ 100
METRIC RATING
258th/ 347
METRIC RANK
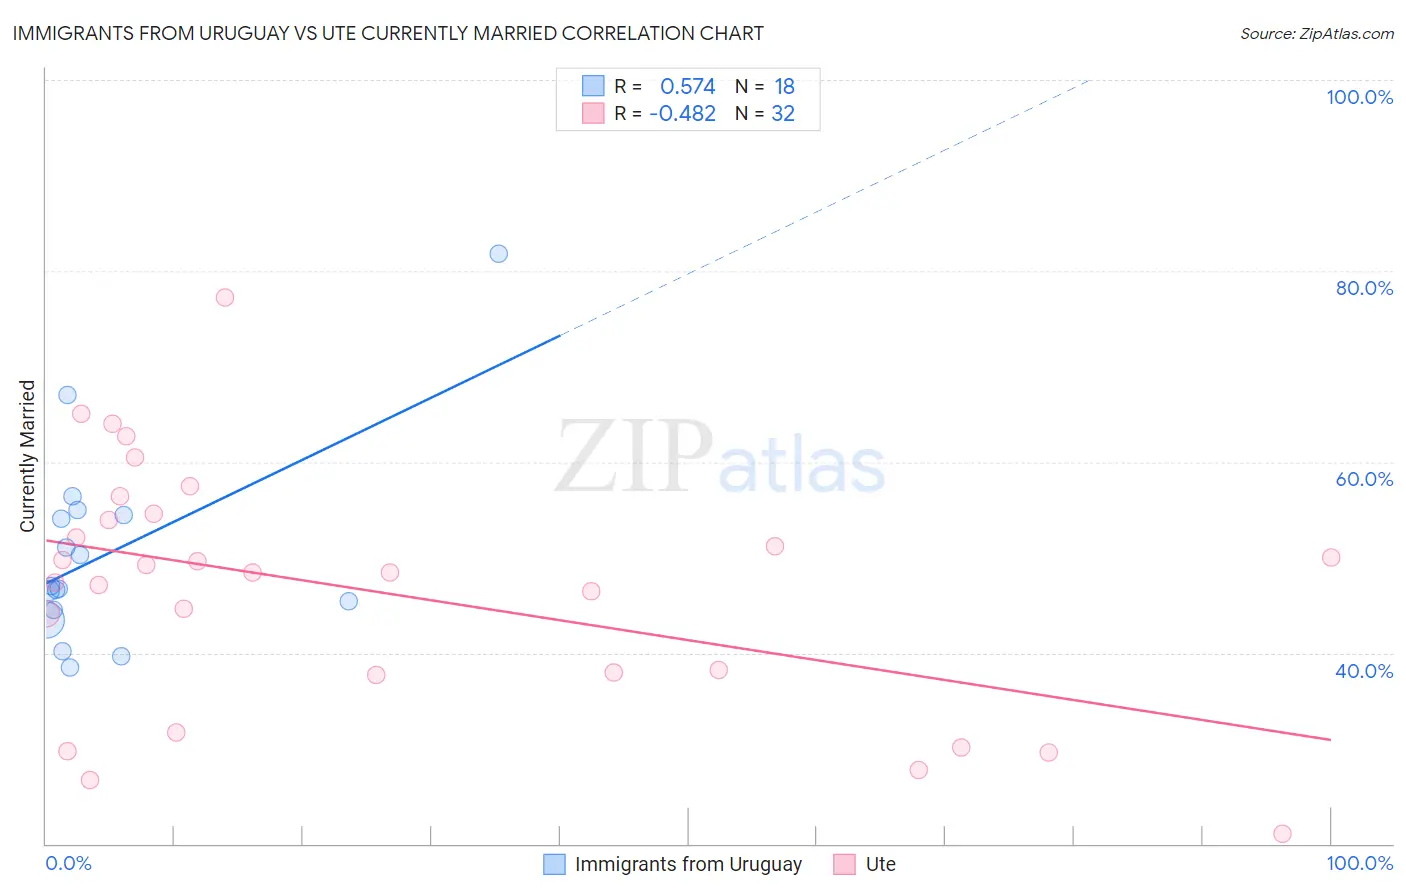
Immigrants from Uruguay vs Ute Currently Married Correlation Chart
The statistical analysis conducted on geographies consisting of 133,250,872 people shows a substantial positive correlation between the proportion of Immigrants from Uruguay and percentage of population currently married in the United States with a correlation coefficient (R) of 0.574 and weighted average of 45.0%. Similarly, the statistical analysis conducted on geographies consisting of 55,668,599 people shows a moderate negative correlation between the proportion of Ute and percentage of population currently married in the United States with a correlation coefficient (R) of -0.482 and weighted average of 43.9%, a difference of 2.5%.
Currently Married Correlation Summary
| Measurement | Immigrants from Uruguay | Ute |
| Minimum | 38.5% | 21.0% |
| Maximum | 81.8% | 77.2% |
| Range | 43.3% | 56.2% |
| Mean | 50.5% | 46.6% |
| Median | 46.8% | 48.4% |
| Interquartile 25% (IQ1) | 44.5% | 37.9% |
| Interquartile 75% (IQ3) | 54.4% | 54.2% |
| Interquartile Range (IQR) | 9.9% | 16.4% |
| Standard Deviation (Sample) | 10.5% | 12.9% |
| Standard Deviation (Population) | 10.2% | 12.7% |
Similar Demographics by Currently Married
Demographics Similar to Immigrants from Uruguay by Currently Married
In terms of currently married, the demographic groups most similar to Immigrants from Uruguay are Spanish American (45.0%, a difference of 0.0%), Comanche (45.0%, a difference of 0.010%), Immigrants from Uganda (45.0%, a difference of 0.060%), French American Indian (45.0%, a difference of 0.060%), and Immigrants from Laos (45.0%, a difference of 0.11%).
| Demographics | Rating | Rank | Currently Married |
| Mexicans | 3.0 /100 | #221 | Tragic 45.2% |
| Immigrants | Azores | 2.5 /100 | #222 | Tragic 45.1% |
| Immigrants | Laos | 2.3 /100 | #223 | Tragic 45.0% |
| Immigrants | Uganda | 2.2 /100 | #224 | Tragic 45.0% |
| French American Indians | 2.2 /100 | #225 | Tragic 45.0% |
| Comanche | 2.1 /100 | #226 | Tragic 45.0% |
| Spanish Americans | 2.1 /100 | #227 | Tragic 45.0% |
| Immigrants | Uruguay | 2.0 /100 | #228 | Tragic 45.0% |
| Cree | 1.7 /100 | #229 | Tragic 44.9% |
| Immigrants | Kenya | 1.6 /100 | #230 | Tragic 44.9% |
| Immigrants | Panama | 1.5 /100 | #231 | Tragic 44.9% |
| Nepalese | 1.2 /100 | #232 | Tragic 44.7% |
| Immigrants | Saudi Arabia | 1.1 /100 | #233 | Tragic 44.7% |
| Iroquois | 1.1 /100 | #234 | Tragic 44.7% |
| Alaskan Athabascans | 0.9 /100 | #235 | Tragic 44.6% |
Demographics Similar to Ute by Currently Married
In terms of currently married, the demographic groups most similar to Ute are Immigrants from Africa (43.9%, a difference of 0.010%), Shoshone (44.0%, a difference of 0.21%), Immigrants from Sierra Leone (43.8%, a difference of 0.21%), Yakama (44.0%, a difference of 0.26%), and Immigrants from Latin America (43.8%, a difference of 0.27%).
| Demographics | Rating | Rank | Currently Married |
| Blackfeet | 0.3 /100 | #251 | Tragic 44.2% |
| Hispanics or Latinos | 0.3 /100 | #252 | Tragic 44.1% |
| Immigrants | Central America | 0.3 /100 | #253 | Tragic 44.1% |
| Vietnamese | 0.2 /100 | #254 | Tragic 44.0% |
| Yakama | 0.2 /100 | #255 | Tragic 44.0% |
| Shoshone | 0.2 /100 | #256 | Tragic 44.0% |
| Immigrants | Africa | 0.2 /100 | #257 | Tragic 43.9% |
| Ute | 0.2 /100 | #258 | Tragic 43.9% |
| Immigrants | Sierra Leone | 0.1 /100 | #259 | Tragic 43.8% |
| Immigrants | Latin America | 0.1 /100 | #260 | Tragic 43.8% |
| Immigrants | Nicaragua | 0.1 /100 | #261 | Tragic 43.7% |
| Bangladeshis | 0.1 /100 | #262 | Tragic 43.7% |
| Immigrants | Cuba | 0.1 /100 | #263 | Tragic 43.7% |
| Sudanese | 0.1 /100 | #264 | Tragic 43.7% |
| Immigrants | Bangladesh | 0.1 /100 | #265 | Tragic 43.6% |