Immigrants from India vs Moroccan Median Earnings
COMPARE
Immigrants from India
Moroccan
Median Earnings
Median Earnings Comparison
Immigrants from India
Moroccans
$60,648
MEDIAN EARNINGS
100.0/ 100
METRIC RATING
3rd/ 347
METRIC RANK
$48,838
MEDIAN EARNINGS
96.7/ 100
METRIC RATING
114th/ 347
METRIC RANK
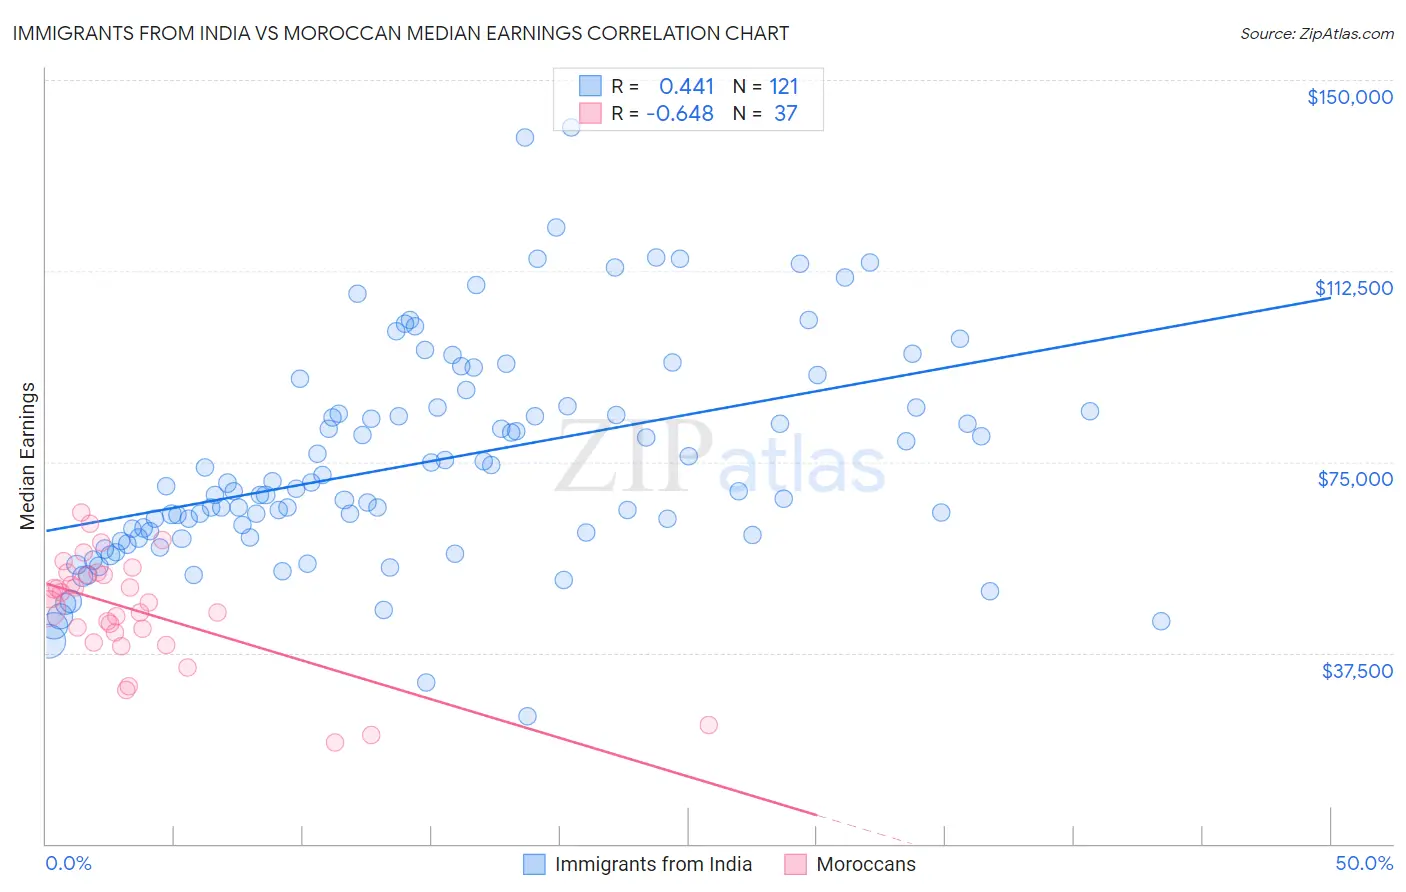
Immigrants from India vs Moroccan Median Earnings Correlation Chart
The statistical analysis conducted on geographies consisting of 434,105,381 people shows a moderate positive correlation between the proportion of Immigrants from India and median earnings in the United States with a correlation coefficient (R) of 0.441 and weighted average of $60,648. Similarly, the statistical analysis conducted on geographies consisting of 201,800,770 people shows a significant negative correlation between the proportion of Moroccans and median earnings in the United States with a correlation coefficient (R) of -0.648 and weighted average of $48,838, a difference of 24.2%.
Median Earnings Correlation Summary
| Measurement | Immigrants from India | Moroccan |
| Minimum | $24,957 | $19,886 |
| Maximum | $140,742 | $64,979 |
| Range | $115,785 | $45,093 |
| Mean | $74,941 | $45,820 |
| Median | $69,769 | $47,333 |
| Interquartile 25% (IQ1) | $60,363 | $40,473 |
| Interquartile 75% (IQ3) | $85,753 | $53,052 |
| Interquartile Range (IQR) | $25,390 | $12,578 |
| Standard Deviation (Sample) | $21,309 | $10,819 |
| Standard Deviation (Population) | $21,220 | $10,672 |
Similar Demographics by Median Earnings
Demographics Similar to Immigrants from India by Median Earnings
In terms of median earnings, the demographic groups most similar to Immigrants from India are Immigrants from Taiwan ($61,151, a difference of 0.83%), Filipino ($61,197, a difference of 0.91%), Immigrants from Hong Kong ($59,433, a difference of 2.0%), Thai ($59,237, a difference of 2.4%), and Immigrants from Singapore ($59,038, a difference of 2.7%).
| Demographics | Rating | Rank | Median Earnings |
| Filipinos | 100.0 /100 | #1 | Exceptional $61,197 |
| Immigrants | Taiwan | 100.0 /100 | #2 | Exceptional $61,151 |
| Immigrants | India | 100.0 /100 | #3 | Exceptional $60,648 |
| Immigrants | Hong Kong | 100.0 /100 | #4 | Exceptional $59,433 |
| Thais | 100.0 /100 | #5 | Exceptional $59,237 |
| Immigrants | Singapore | 100.0 /100 | #6 | Exceptional $59,038 |
| Iranians | 100.0 /100 | #7 | Exceptional $58,474 |
| Immigrants | Iran | 100.0 /100 | #8 | Exceptional $57,612 |
| Okinawans | 100.0 /100 | #9 | Exceptional $57,550 |
| Immigrants | South Central Asia | 100.0 /100 | #10 | Exceptional $57,114 |
| Immigrants | Israel | 100.0 /100 | #11 | Exceptional $57,034 |
| Immigrants | Ireland | 100.0 /100 | #12 | Exceptional $56,854 |
| Immigrants | China | 100.0 /100 | #13 | Exceptional $56,638 |
| Immigrants | Australia | 100.0 /100 | #14 | Exceptional $56,305 |
| Indians (Asian) | 100.0 /100 | #15 | Exceptional $56,253 |
Demographics Similar to Moroccans by Median Earnings
In terms of median earnings, the demographic groups most similar to Moroccans are Chinese ($48,836, a difference of 0.010%), Immigrants from Kuwait ($48,861, a difference of 0.050%), Northern European ($48,887, a difference of 0.10%), Immigrants from Zimbabwe ($48,913, a difference of 0.15%), and Immigrants from Ethiopia ($48,924, a difference of 0.17%).
| Demographics | Rating | Rank | Median Earnings |
| Immigrants | Morocco | 98.4 /100 | #107 | Exceptional $49,368 |
| Palestinians | 98.0 /100 | #108 | Exceptional $49,209 |
| Syrians | 97.1 /100 | #109 | Exceptional $48,934 |
| Immigrants | Ethiopia | 97.1 /100 | #110 | Exceptional $48,924 |
| Immigrants | Zimbabwe | 97.0 /100 | #111 | Exceptional $48,913 |
| Northern Europeans | 96.9 /100 | #112 | Exceptional $48,887 |
| Immigrants | Kuwait | 96.8 /100 | #113 | Exceptional $48,861 |
| Moroccans | 96.7 /100 | #114 | Exceptional $48,838 |
| Chinese | 96.7 /100 | #115 | Exceptional $48,836 |
| Koreans | 96.2 /100 | #116 | Exceptional $48,727 |
| Serbians | 95.9 /100 | #117 | Exceptional $48,677 |
| Immigrants | Jordan | 95.9 /100 | #118 | Exceptional $48,673 |
| Poles | 95.8 /100 | #119 | Exceptional $48,659 |
| Carpatho Rusyns | 95.5 /100 | #120 | Exceptional $48,617 |
| Arabs | 95.4 /100 | #121 | Exceptional $48,599 |