Carpatho Rusyn vs Icelander Median Earnings
COMPARE
Carpatho Rusyn
Icelander
Median Earnings
Median Earnings Comparison
Carpatho Rusyns
Icelanders
$48,617
MEDIAN EARNINGS
95.5/ 100
METRIC RATING
120th/ 347
METRIC RANK
$46,916
MEDIAN EARNINGS
66.3/ 100
METRIC RATING
163rd/ 347
METRIC RANK
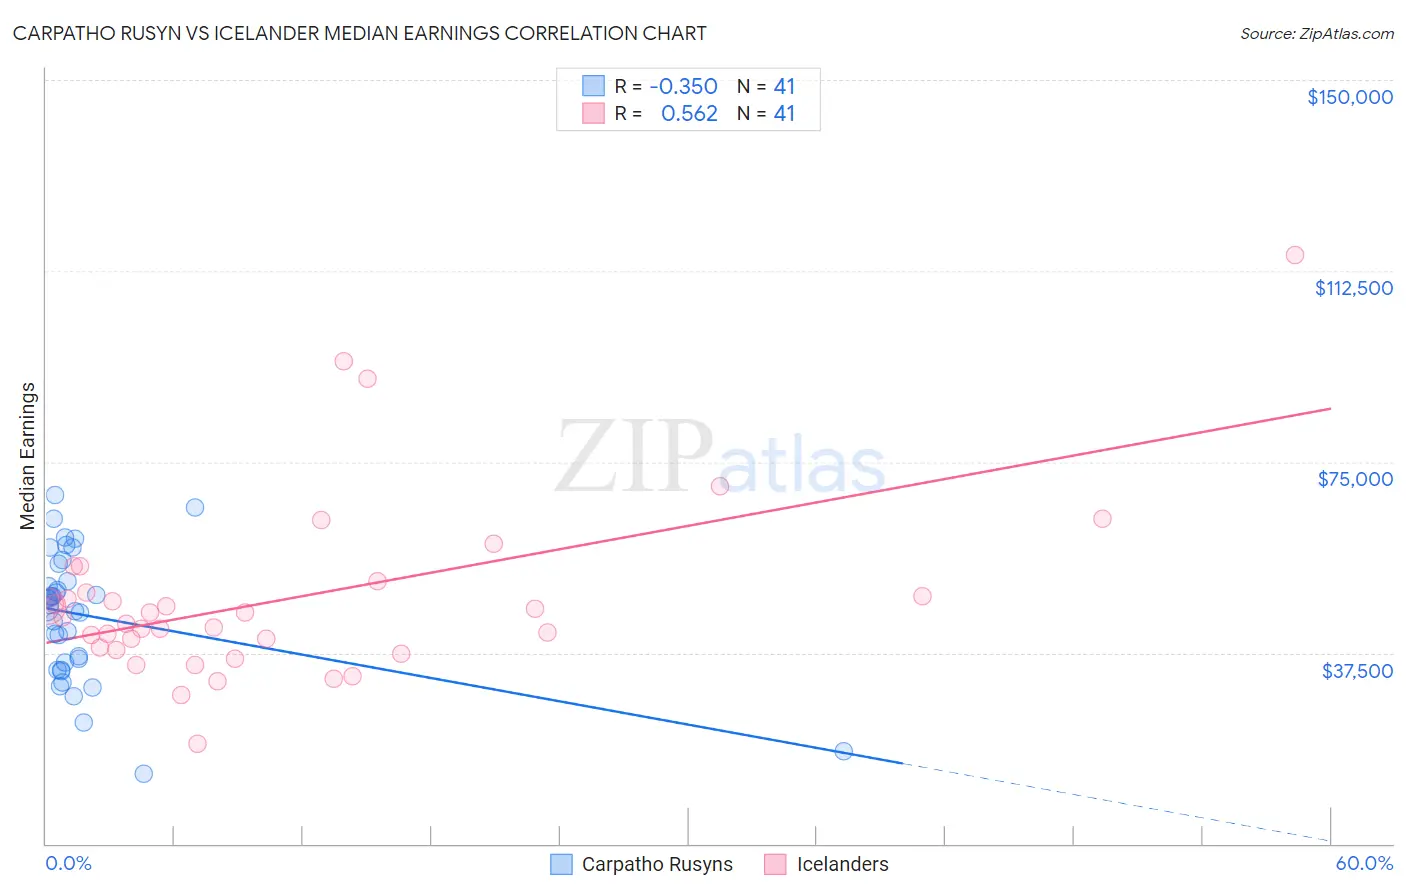
Carpatho Rusyn vs Icelander Median Earnings Correlation Chart
The statistical analysis conducted on geographies consisting of 58,866,831 people shows a mild negative correlation between the proportion of Carpatho Rusyns and median earnings in the United States with a correlation coefficient (R) of -0.350 and weighted average of $48,617. Similarly, the statistical analysis conducted on geographies consisting of 159,666,599 people shows a substantial positive correlation between the proportion of Icelanders and median earnings in the United States with a correlation coefficient (R) of 0.562 and weighted average of $46,916, a difference of 3.6%.
Median Earnings Correlation Summary
| Measurement | Carpatho Rusyn | Icelander |
| Minimum | $13,750 | $19,583 |
| Maximum | $68,541 | $115,625 |
| Range | $54,791 | $96,042 |
| Mean | $44,793 | $48,186 |
| Median | $46,820 | $44,536 |
| Interquartile 25% (IQ1) | $34,839 | $38,407 |
| Interquartile 75% (IQ3) | $53,317 | $50,498 |
| Interquartile Range (IQR) | $18,479 | $12,091 |
| Standard Deviation (Sample) | $12,606 | $17,953 |
| Standard Deviation (Population) | $12,452 | $17,732 |
Similar Demographics by Median Earnings
Demographics Similar to Carpatho Rusyns by Median Earnings
In terms of median earnings, the demographic groups most similar to Carpatho Rusyns are Arab ($48,599, a difference of 0.040%), Polish ($48,659, a difference of 0.080%), Immigrants from Jordan ($48,673, a difference of 0.11%), Serbian ($48,677, a difference of 0.12%), and Korean ($48,727, a difference of 0.23%).
| Demographics | Rating | Rank | Median Earnings |
| Immigrants | Kuwait | 96.8 /100 | #113 | Exceptional $48,861 |
| Moroccans | 96.7 /100 | #114 | Exceptional $48,838 |
| Chinese | 96.7 /100 | #115 | Exceptional $48,836 |
| Koreans | 96.2 /100 | #116 | Exceptional $48,727 |
| Serbians | 95.9 /100 | #117 | Exceptional $48,677 |
| Immigrants | Jordan | 95.9 /100 | #118 | Exceptional $48,673 |
| Poles | 95.8 /100 | #119 | Exceptional $48,659 |
| Carpatho Rusyns | 95.5 /100 | #120 | Exceptional $48,617 |
| Arabs | 95.4 /100 | #121 | Exceptional $48,599 |
| Chileans | 94.8 /100 | #122 | Exceptional $48,504 |
| Immigrants | Syria | 93.9 /100 | #123 | Exceptional $48,375 |
| Brazilians | 93.7 /100 | #124 | Exceptional $48,356 |
| Immigrants | Fiji | 93.3 /100 | #125 | Exceptional $48,305 |
| Assyrians/Chaldeans/Syriacs | 93.3 /100 | #126 | Exceptional $48,304 |
| Sierra Leoneans | 93.1 /100 | #127 | Exceptional $48,286 |
Demographics Similar to Icelanders by Median Earnings
In terms of median earnings, the demographic groups most similar to Icelanders are South American Indian ($46,952, a difference of 0.080%), Immigrants from Eastern Africa ($46,969, a difference of 0.11%), Norwegian ($46,865, a difference of 0.11%), Immigrants from Peru ($47,025, a difference of 0.23%), and Alsatian ($47,023, a difference of 0.23%).
| Demographics | Rating | Rank | Median Earnings |
| Irish | 76.6 /100 | #156 | Good $47,276 |
| Czechs | 75.1 /100 | #157 | Good $47,221 |
| Slovaks | 71.7 /100 | #158 | Good $47,095 |
| Immigrants | Peru | 69.6 /100 | #159 | Good $47,025 |
| Alsatians | 69.6 /100 | #160 | Good $47,023 |
| Immigrants | Eastern Africa | 68.0 /100 | #161 | Good $46,969 |
| South American Indians | 67.4 /100 | #162 | Good $46,952 |
| Icelanders | 66.3 /100 | #163 | Good $46,916 |
| Norwegians | 64.7 /100 | #164 | Good $46,865 |
| South Americans | 62.7 /100 | #165 | Good $46,804 |
| Czechoslovakians | 57.8 /100 | #166 | Average $46,658 |
| Costa Ricans | 57.4 /100 | #167 | Average $46,645 |
| Immigrants | Africa | 54.6 /100 | #168 | Average $46,564 |
| Immigrants | South America | 54.0 /100 | #169 | Average $46,548 |
| Immigrants | Immigrants | 51.6 /100 | #170 | Average $46,478 |