U.S. Virgin Islander vs Icelander Median Earnings
COMPARE
U.S. Virgin Islander
Icelander
Median Earnings
Median Earnings Comparison
U.S. Virgin Islanders
Icelanders
$41,448
MEDIAN EARNINGS
0.1/ 100
METRIC RATING
292nd/ 347
METRIC RANK
$46,916
MEDIAN EARNINGS
66.3/ 100
METRIC RATING
163rd/ 347
METRIC RANK
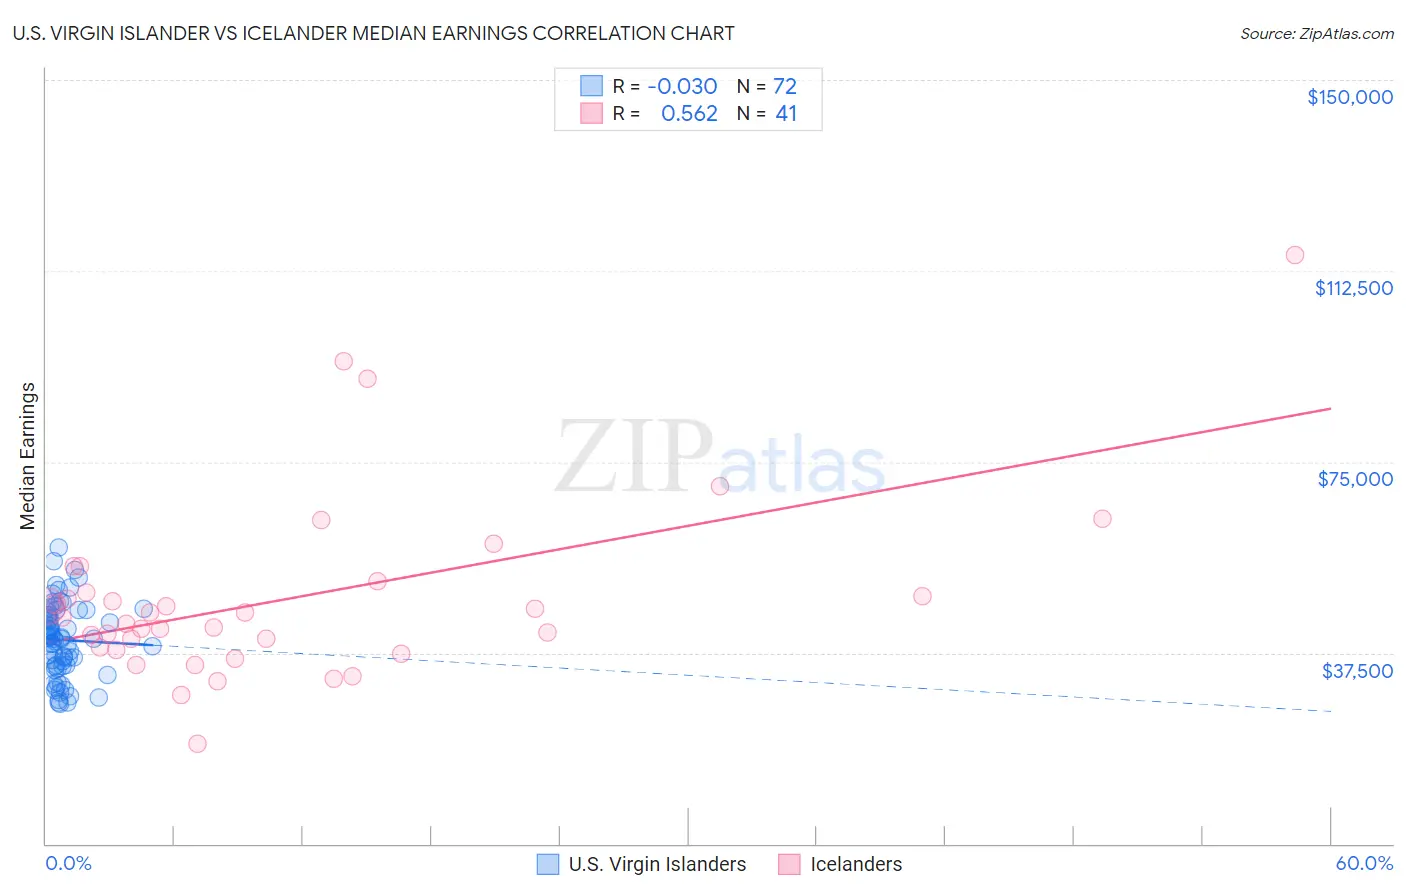
U.S. Virgin Islander vs Icelander Median Earnings Correlation Chart
The statistical analysis conducted on geographies consisting of 87,526,165 people shows no correlation between the proportion of U.S. Virgin Islanders and median earnings in the United States with a correlation coefficient (R) of -0.030 and weighted average of $41,448. Similarly, the statistical analysis conducted on geographies consisting of 159,666,599 people shows a substantial positive correlation between the proportion of Icelanders and median earnings in the United States with a correlation coefficient (R) of 0.562 and weighted average of $46,916, a difference of 13.2%.
Median Earnings Correlation Summary
| Measurement | U.S. Virgin Islander | Icelander |
| Minimum | $27,466 | $19,583 |
| Maximum | $58,251 | $115,625 |
| Range | $30,785 | $96,042 |
| Mean | $39,999 | $48,186 |
| Median | $40,206 | $44,536 |
| Interquartile 25% (IQ1) | $35,022 | $38,407 |
| Interquartile 75% (IQ3) | $45,141 | $50,498 |
| Interquartile Range (IQR) | $10,119 | $12,091 |
| Standard Deviation (Sample) | $7,165 | $17,953 |
| Standard Deviation (Population) | $7,115 | $17,732 |
Similar Demographics by Median Earnings
Demographics Similar to U.S. Virgin Islanders by Median Earnings
In terms of median earnings, the demographic groups most similar to U.S. Virgin Islanders are Central American Indian ($41,474, a difference of 0.060%), Paiute ($41,508, a difference of 0.15%), Comanche ($41,519, a difference of 0.17%), Immigrants from Dominican Republic ($41,554, a difference of 0.26%), and Immigrants from Zaire ($41,325, a difference of 0.30%).
| Demographics | Rating | Rank | Median Earnings |
| Immigrants | Nicaragua | 0.1 /100 | #285 | Tragic $41,737 |
| Mexican American Indians | 0.1 /100 | #286 | Tragic $41,719 |
| Indonesians | 0.1 /100 | #287 | Tragic $41,701 |
| Immigrants | Dominican Republic | 0.1 /100 | #288 | Tragic $41,554 |
| Comanche | 0.1 /100 | #289 | Tragic $41,519 |
| Paiute | 0.1 /100 | #290 | Tragic $41,508 |
| Central American Indians | 0.1 /100 | #291 | Tragic $41,474 |
| U.S. Virgin Islanders | 0.1 /100 | #292 | Tragic $41,448 |
| Immigrants | Zaire | 0.1 /100 | #293 | Tragic $41,325 |
| Potawatomi | 0.1 /100 | #294 | Tragic $41,288 |
| Bangladeshis | 0.1 /100 | #295 | Tragic $41,263 |
| Cherokee | 0.1 /100 | #296 | Tragic $41,252 |
| Guatemalans | 0.1 /100 | #297 | Tragic $41,205 |
| Immigrants | Micronesia | 0.1 /100 | #298 | Tragic $41,133 |
| Immigrants | Caribbean | 0.1 /100 | #299 | Tragic $41,119 |
Demographics Similar to Icelanders by Median Earnings
In terms of median earnings, the demographic groups most similar to Icelanders are South American Indian ($46,952, a difference of 0.080%), Immigrants from Eastern Africa ($46,969, a difference of 0.11%), Norwegian ($46,865, a difference of 0.11%), Immigrants from Peru ($47,025, a difference of 0.23%), and Alsatian ($47,023, a difference of 0.23%).
| Demographics | Rating | Rank | Median Earnings |
| Irish | 76.6 /100 | #156 | Good $47,276 |
| Czechs | 75.1 /100 | #157 | Good $47,221 |
| Slovaks | 71.7 /100 | #158 | Good $47,095 |
| Immigrants | Peru | 69.6 /100 | #159 | Good $47,025 |
| Alsatians | 69.6 /100 | #160 | Good $47,023 |
| Immigrants | Eastern Africa | 68.0 /100 | #161 | Good $46,969 |
| South American Indians | 67.4 /100 | #162 | Good $46,952 |
| Icelanders | 66.3 /100 | #163 | Good $46,916 |
| Norwegians | 64.7 /100 | #164 | Good $46,865 |
| South Americans | 62.7 /100 | #165 | Good $46,804 |
| Czechoslovakians | 57.8 /100 | #166 | Average $46,658 |
| Costa Ricans | 57.4 /100 | #167 | Average $46,645 |
| Immigrants | Africa | 54.6 /100 | #168 | Average $46,564 |
| Immigrants | South America | 54.0 /100 | #169 | Average $46,548 |
| Immigrants | Immigrants | 51.6 /100 | #170 | Average $46,478 |