Immigrants from South America vs British Median Earnings
COMPARE
Immigrants from South America
British
Median Earnings
Median Earnings Comparison
Immigrants from South America
British
$46,548
MEDIAN EARNINGS
54.0/ 100
METRIC RATING
169th/ 347
METRIC RANK
$48,189
MEDIAN EARNINGS
92.2/ 100
METRIC RATING
132nd/ 347
METRIC RANK
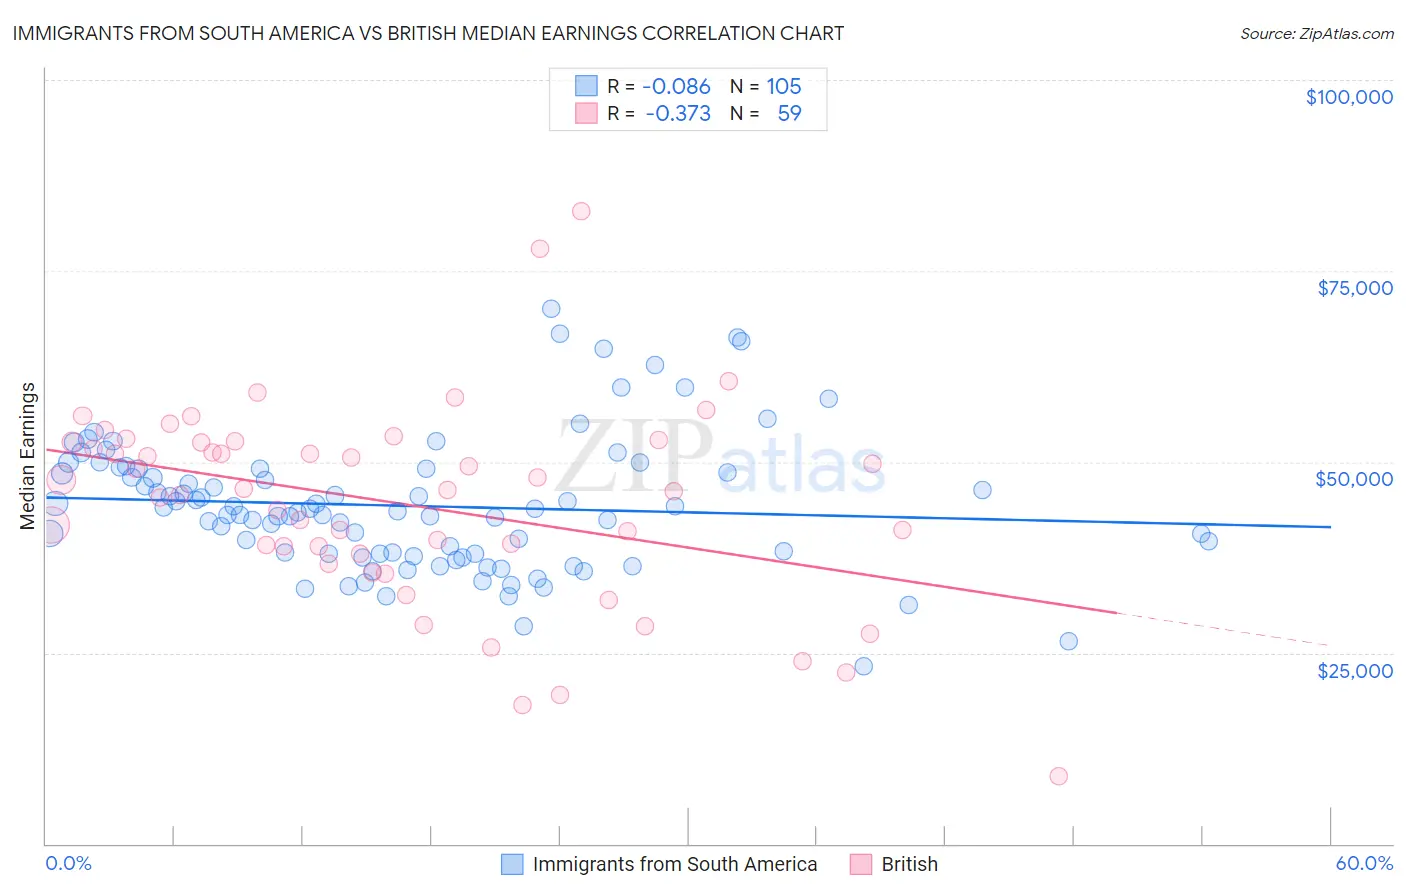
Immigrants from South America vs British Median Earnings Correlation Chart
The statistical analysis conducted on geographies consisting of 486,376,304 people shows a slight negative correlation between the proportion of Immigrants from South America and median earnings in the United States with a correlation coefficient (R) of -0.086 and weighted average of $46,548. Similarly, the statistical analysis conducted on geographies consisting of 531,344,409 people shows a mild negative correlation between the proportion of British and median earnings in the United States with a correlation coefficient (R) of -0.373 and weighted average of $48,189, a difference of 3.5%.
Median Earnings Correlation Summary
| Measurement | Immigrants from South America | British |
| Minimum | $23,314 | $8,915 |
| Maximum | $70,000 | $82,773 |
| Range | $46,686 | $73,858 |
| Mean | $44,228 | $44,491 |
| Median | $43,615 | $46,291 |
| Interquartile 25% (IQ1) | $37,956 | $37,889 |
| Interquartile 75% (IQ3) | $49,134 | $52,582 |
| Interquartile Range (IQR) | $11,178 | $14,693 |
| Standard Deviation (Sample) | $8,760 | $13,191 |
| Standard Deviation (Population) | $8,718 | $13,079 |
Similar Demographics by Median Earnings
Demographics Similar to Immigrants from South America by Median Earnings
In terms of median earnings, the demographic groups most similar to Immigrants from South America are Immigrants from Africa ($46,564, a difference of 0.030%), Immigrants ($46,478, a difference of 0.15%), Scottish ($46,463, a difference of 0.18%), Kenyan ($46,462, a difference of 0.18%), and Costa Rican ($46,645, a difference of 0.21%).
| Demographics | Rating | Rank | Median Earnings |
| South American Indians | 67.4 /100 | #162 | Good $46,952 |
| Icelanders | 66.3 /100 | #163 | Good $46,916 |
| Norwegians | 64.7 /100 | #164 | Good $46,865 |
| South Americans | 62.7 /100 | #165 | Good $46,804 |
| Czechoslovakians | 57.8 /100 | #166 | Average $46,658 |
| Costa Ricans | 57.4 /100 | #167 | Average $46,645 |
| Immigrants | Africa | 54.6 /100 | #168 | Average $46,564 |
| Immigrants | South America | 54.0 /100 | #169 | Average $46,548 |
| Immigrants | Immigrants | 51.6 /100 | #170 | Average $46,478 |
| Scottish | 51.1 /100 | #171 | Average $46,463 |
| Kenyans | 51.0 /100 | #172 | Average $46,462 |
| Ghanaians | 50.3 /100 | #173 | Average $46,440 |
| Scandinavians | 50.0 /100 | #174 | Average $46,433 |
| Basques | 48.8 /100 | #175 | Average $46,399 |
| Danes | 48.6 /100 | #176 | Average $46,392 |
Demographics Similar to British by Median Earnings
In terms of median earnings, the demographic groups most similar to British are Zimbabwean ($48,229, a difference of 0.080%), Lebanese ($48,226, a difference of 0.080%), Pakistani ($48,254, a difference of 0.14%), Immigrants from Philippines ($48,266, a difference of 0.16%), and Sierra Leonean ($48,286, a difference of 0.20%).
| Demographics | Rating | Rank | Median Earnings |
| Immigrants | Fiji | 93.3 /100 | #125 | Exceptional $48,305 |
| Assyrians/Chaldeans/Syriacs | 93.3 /100 | #126 | Exceptional $48,304 |
| Sierra Leoneans | 93.1 /100 | #127 | Exceptional $48,286 |
| Immigrants | Philippines | 92.9 /100 | #128 | Exceptional $48,266 |
| Pakistanis | 92.8 /100 | #129 | Exceptional $48,254 |
| Zimbabweans | 92.6 /100 | #130 | Exceptional $48,229 |
| Lebanese | 92.5 /100 | #131 | Exceptional $48,226 |
| British | 92.2 /100 | #132 | Exceptional $48,189 |
| Immigrants | Uganda | 90.5 /100 | #133 | Exceptional $48,041 |
| Sri Lankans | 90.5 /100 | #134 | Exceptional $48,040 |
| Portuguese | 90.4 /100 | #135 | Exceptional $48,032 |
| Slovenes | 90.0 /100 | #136 | Excellent $47,995 |
| Immigrants | Nepal | 89.0 /100 | #137 | Excellent $47,925 |
| Europeans | 88.9 /100 | #138 | Excellent $47,915 |
| Canadians | 88.8 /100 | #139 | Excellent $47,911 |