Immigrants from Brazil vs British Median Earnings
COMPARE
Immigrants from Brazil
British
Median Earnings
Median Earnings Comparison
Immigrants from Brazil
British
$49,463
MEDIAN EARNINGS
98.6/ 100
METRIC RATING
104th/ 347
METRIC RANK
$48,189
MEDIAN EARNINGS
92.2/ 100
METRIC RATING
132nd/ 347
METRIC RANK
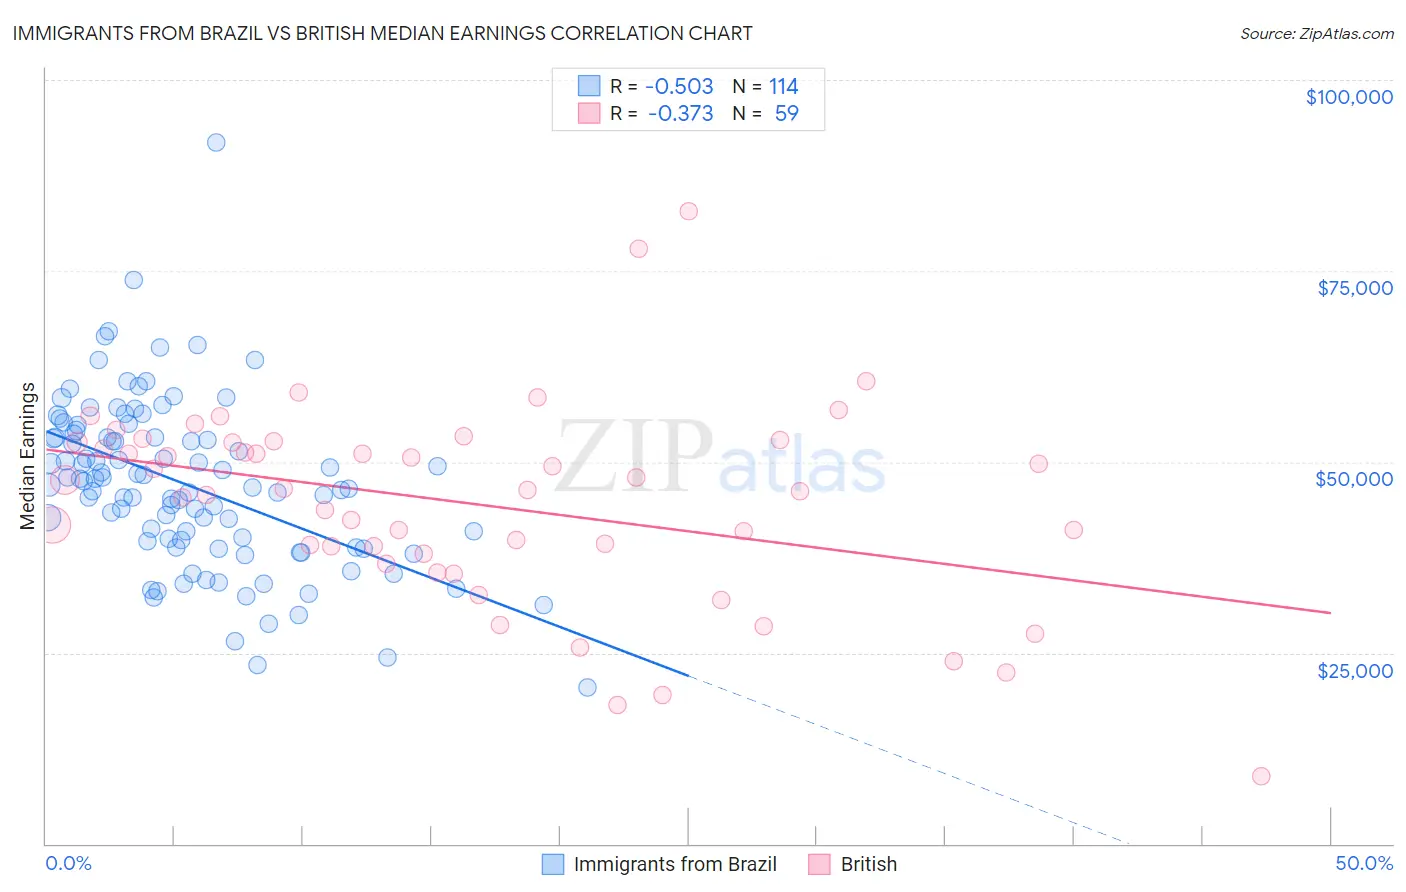
Immigrants from Brazil vs British Median Earnings Correlation Chart
The statistical analysis conducted on geographies consisting of 343,004,043 people shows a substantial negative correlation between the proportion of Immigrants from Brazil and median earnings in the United States with a correlation coefficient (R) of -0.503 and weighted average of $49,463. Similarly, the statistical analysis conducted on geographies consisting of 531,344,409 people shows a mild negative correlation between the proportion of British and median earnings in the United States with a correlation coefficient (R) of -0.373 and weighted average of $48,189, a difference of 2.6%.
Median Earnings Correlation Summary
| Measurement | Immigrants from Brazil | British |
| Minimum | $20,417 | $8,915 |
| Maximum | $91,768 | $82,773 |
| Range | $71,351 | $73,858 |
| Mean | $47,008 | $44,491 |
| Median | $47,178 | $46,291 |
| Interquartile 25% (IQ1) | $39,617 | $37,889 |
| Interquartile 75% (IQ3) | $53,219 | $52,582 |
| Interquartile Range (IQR) | $13,601 | $14,693 |
| Standard Deviation (Sample) | $10,976 | $13,191 |
| Standard Deviation (Population) | $10,928 | $13,079 |
Similar Demographics by Median Earnings
Demographics Similar to Immigrants from Brazil by Median Earnings
In terms of median earnings, the demographic groups most similar to Immigrants from Brazil are Austrian ($49,501, a difference of 0.080%), Immigrants from Western Asia ($49,389, a difference of 0.15%), Immigrants from Albania ($49,377, a difference of 0.17%), Immigrants from Morocco ($49,368, a difference of 0.19%), and Ethiopian ($49,572, a difference of 0.22%).
| Demographics | Rating | Rank | Median Earnings |
| Immigrants | North Macedonia | 98.9 /100 | #97 | Exceptional $49,658 |
| Immigrants | Northern Africa | 98.9 /100 | #98 | Exceptional $49,648 |
| Immigrants | Afghanistan | 98.9 /100 | #99 | Exceptional $49,645 |
| Immigrants | Poland | 98.9 /100 | #100 | Exceptional $49,633 |
| Jordanians | 98.9 /100 | #101 | Exceptional $49,632 |
| Ethiopians | 98.8 /100 | #102 | Exceptional $49,572 |
| Austrians | 98.7 /100 | #103 | Exceptional $49,501 |
| Immigrants | Brazil | 98.6 /100 | #104 | Exceptional $49,463 |
| Immigrants | Western Asia | 98.4 /100 | #105 | Exceptional $49,389 |
| Immigrants | Albania | 98.4 /100 | #106 | Exceptional $49,377 |
| Immigrants | Morocco | 98.4 /100 | #107 | Exceptional $49,368 |
| Palestinians | 98.0 /100 | #108 | Exceptional $49,209 |
| Syrians | 97.1 /100 | #109 | Exceptional $48,934 |
| Immigrants | Ethiopia | 97.1 /100 | #110 | Exceptional $48,924 |
| Immigrants | Zimbabwe | 97.0 /100 | #111 | Exceptional $48,913 |
Demographics Similar to British by Median Earnings
In terms of median earnings, the demographic groups most similar to British are Zimbabwean ($48,229, a difference of 0.080%), Lebanese ($48,226, a difference of 0.080%), Pakistani ($48,254, a difference of 0.14%), Immigrants from Philippines ($48,266, a difference of 0.16%), and Sierra Leonean ($48,286, a difference of 0.20%).
| Demographics | Rating | Rank | Median Earnings |
| Immigrants | Fiji | 93.3 /100 | #125 | Exceptional $48,305 |
| Assyrians/Chaldeans/Syriacs | 93.3 /100 | #126 | Exceptional $48,304 |
| Sierra Leoneans | 93.1 /100 | #127 | Exceptional $48,286 |
| Immigrants | Philippines | 92.9 /100 | #128 | Exceptional $48,266 |
| Pakistanis | 92.8 /100 | #129 | Exceptional $48,254 |
| Zimbabweans | 92.6 /100 | #130 | Exceptional $48,229 |
| Lebanese | 92.5 /100 | #131 | Exceptional $48,226 |
| British | 92.2 /100 | #132 | Exceptional $48,189 |
| Immigrants | Uganda | 90.5 /100 | #133 | Exceptional $48,041 |
| Sri Lankans | 90.5 /100 | #134 | Exceptional $48,040 |
| Portuguese | 90.4 /100 | #135 | Exceptional $48,032 |
| Slovenes | 90.0 /100 | #136 | Excellent $47,995 |
| Immigrants | Nepal | 89.0 /100 | #137 | Excellent $47,925 |
| Europeans | 88.9 /100 | #138 | Excellent $47,915 |
| Canadians | 88.8 /100 | #139 | Excellent $47,911 |