Immigrants from Turkey vs Sioux Median Family Income

COMPARE

Immigrants from Turkey
Race
Ancestry
AfghanAfricanAlaska NativeAlaskan AthabascanAlbanianAleutAlsatianAmericanApacheArabArapahoArgentineanArmenianAssyrian/Chaldean/SyriacAustralianAustrianBahamianBangladeshiBarbadianBasqueBelgianBelizeanBermudanBhutaneseBlackfeetBolivianBrazilianBritishBritish West IndianBulgarianBurmeseCajunCambodianCanadianCape VerdeanCarpatho RusynCelticCentral AmericanCentral American IndianCherokeeCheyenneChickasawChileanChineseChippewaChoctawColombianColvilleComancheCosta RicanCreeCreekCroatianCrowCubanCypriotCzechCzechoslovakianDanishDelawareDominicanDutchDutch West IndianEastern EuropeanEcuadorianEgyptianEnglishEstonianEthiopianEuropeanFijianFilipinoFinnishFrenchFrench American IndianFrench CanadianGermanGerman RussianGhanaianGreekGuamanian/ChamorroGuatemalanGuyaneseHaitianHmongHonduranHopiHoumaHungarianIcelanderIndian (Asian)IndonesianInupiatIranianIraqiIrishIroquoisIsraeliItalianJamaicanJapaneseJordanianKenyanKiowaKoreanLaotianLatvianLebaneseLiberianLithuanianLumbeeLuxembourgerMacedonianMalaysianMalteseMarshalleseMenomineeMexicanMexican American IndianMongolianMoroccanNative HawaiianNavajoNepaleseNew ZealanderNicaraguanNigerianNorthern EuropeanNorwegianOkinawanOsageOttawaPaiutePakistaniPalestinianPanamanianParaguayanPennsylvania GermanPeruvianPimaPolishPortuguesePotawatomiPuebloPuerto RicanPuget Sound SalishRomanianRussianSalvadoranSamoanScandinavianScotch-IrishScottishSeminoleSenegaleseSerbianShoshoneSierra LeoneanSlavicSlovakSloveneSomaliSouth AfricanSouth AmericanSouth American IndianSoviet UnionSpaniardSpanishSpanish AmericanSpanish American IndianSri LankanSubsaharan AfricanSudaneseSwedishSwissSyrianTaiwaneseThaiTlingit-HaidaTohono O'OdhamTonganTrinidadian and TobagonianTsimshianTurkishU.S. Virgin IslanderUgandanUkrainianUruguayanUteVenezuelanVietnameseWelshWest IndianYakamaYaquiYugoslavianYumanYup'ikZimbabwean
Immigration
NonimmigrantsImmigrantsAfghanistanAfricaAlbaniaArgentinaArmeniaAsiaAustraliaAustriaBahamasBangladeshBarbadosBelarusBelgiumBelizeBoliviaBosnia and HerzegovinaBrazilBulgariaBurma/MyanmarCabo VerdeCambodiaCameroonCanadaCaribbeanCentral AmericaChileChinaColombiaCongoCosta RicaCroatiaCubaCzechoslovakiaDenmarkDominicaDominican RepublicEastern AfricaEastern AsiaEastern EuropeEcuadorEgyptEl SalvadorEnglandEritreaEthiopiaEuropeFijiFranceGermanyGhanaGreeceGrenadaGuatemalaGuyanaHaitiHondurasHong KongHungaryIndiaIndonesiaIranIraqIrelandIsraelItalyJamaicaJapanJordanKazakhstanKenyaKoreaKuwaitLaosLatin AmericaLatviaLebanonLiberiaLithuaniaMalaysiaMexicoMicronesiaMiddle AfricaMoldovaMoroccoNepalNetherlandsNicaraguaNigeriaNorth AmericaNorth MacedoniaNorthern AfricaNorthern EuropeNorwayOceaniaPakistanPanamaPeruPhilippinesPolandPortugalRomaniaRussiaSaudi ArabiaScotlandSenegalSerbiaSierra LeoneSingaporeSomaliaSouth AfricaSouth AmericaSouth Central AsiaSouth Eastern AsiaSouthern EuropeSpainSri LankaSt. Vincent and the GrenadinesSudanSwedenSwitzerlandSyriaTaiwanThailandTrinidad and TobagoTurkeyUgandaUkraineUruguayUzbekistanVenezuelaVietnamWest IndiesWestern AfricaWestern AsiaWestern EuropeYemenZaireZimbabweAzores
Sioux
Race
Ancestry
AfghanAfricanAlaska NativeAlaskan AthabascanAlbanianAleutAlsatianAmericanApacheArabArapahoArgentineanArmenianAssyrian/Chaldean/SyriacAustralianAustrianBahamianBangladeshiBarbadianBasqueBelgianBelizeanBermudanBhutaneseBlackfeetBolivianBrazilianBritishBritish West IndianBulgarianBurmeseCajunCambodianCanadianCape VerdeanCarpatho RusynCelticCentral AmericanCentral American IndianCherokeeCheyenneChickasawChileanChineseChippewaChoctawColombianColvilleComancheCosta RicanCreeCreekCroatianCrowCubanCypriotCzechCzechoslovakianDanishDelawareDominicanDutchDutch West IndianEastern EuropeanEcuadorianEgyptianEnglishEstonianEthiopianEuropeanFijianFilipinoFinnishFrenchFrench American IndianFrench CanadianGermanGerman RussianGhanaianGreekGuamanian/ChamorroGuatemalanGuyaneseHaitianHmongHonduranHopiHoumaHungarianIcelanderIndian (Asian)IndonesianInupiatIranianIraqiIrishIroquoisIsraeliItalianJamaicanJapaneseJordanianKenyanKiowaKoreanLaotianLatvianLebaneseLiberianLithuanianLumbeeLuxembourgerMacedonianMalaysianMalteseMarshalleseMenomineeMexicanMexican American IndianMongolianMoroccanNative HawaiianNavajoNepaleseNew ZealanderNicaraguanNigerianNorthern EuropeanNorwegianOkinawanOsageOttawaPaiutePakistaniPalestinianPanamanianParaguayanPennsylvania GermanPeruvianPimaPolishPortuguesePotawatomiPuebloPuerto RicanPuget Sound SalishRomanianRussianSalvadoranSamoanScandinavianScotch-IrishScottishSeminoleSenegaleseSerbianShoshoneSierra LeoneanSiouxSlavicSlovakSloveneSomaliSouth AfricanSouth AmericanSouth American IndianSoviet UnionSpaniardSpanishSpanish AmericanSpanish American IndianSri LankanSubsaharan AfricanSudaneseSwedishSwissSyrianTaiwaneseThaiTlingit-HaidaTohono O'OdhamTonganTrinidadian and TobagonianTsimshianTurkishU.S. Virgin IslanderUgandanUkrainianUruguayanUteVenezuelanVietnameseWelshWest IndianYakamaYaquiYugoslavianYumanYup'ikZimbabwean
Immigration
NonimmigrantsImmigrantsAfghanistanAfricaAlbaniaArgentinaArmeniaAsiaAustraliaAustriaBahamasBangladeshBarbadosBelarusBelgiumBelizeBoliviaBosnia and HerzegovinaBrazilBulgariaBurma/MyanmarCabo VerdeCambodiaCameroonCanadaCaribbeanCentral AmericaChileChinaColombiaCongoCosta RicaCroatiaCubaCzechoslovakiaDenmarkDominicaDominican RepublicEastern AfricaEastern AsiaEastern EuropeEcuadorEgyptEl SalvadorEnglandEritreaEthiopiaEuropeFijiFranceGermanyGhanaGreeceGrenadaGuatemalaGuyanaHaitiHondurasHong KongHungaryIndiaIndonesiaIranIraqIrelandIsraelItalyJamaicaJapanJordanKazakhstanKenyaKoreaKuwaitLaosLatin AmericaLatviaLebanonLiberiaLithuaniaMalaysiaMexicoMicronesiaMiddle AfricaMoldovaMoroccoNepalNetherlandsNicaraguaNigeriaNorth AmericaNorth MacedoniaNorthern AfricaNorthern EuropeNorwayOceaniaPakistanPanamaPeruPhilippinesPolandPortugalRomaniaRussiaSaudi ArabiaScotlandSenegalSerbiaSierra LeoneSingaporeSomaliaSouth AfricaSouth AmericaSouth Central AsiaSouth Eastern AsiaSouthern EuropeSpainSri LankaSt. Vincent and the GrenadinesSudanSwedenSwitzerlandSyriaTaiwanThailandTrinidad and TobagoUgandaUkraineUruguayUzbekistanVenezuelaVietnamWest IndiesWestern AfricaWestern AsiaWestern EuropeYemenZaireZimbabweAzores
Median Family Income
Income
Poverty
Unemployment
Labor Participation
Family Structure
Vehicle Availability
Education Level
Disability

Median Family Income Comparison

Immigrants from Turkey

Sioux

Exceptional
Tragic
$118,325
MEDIAN FAMILY INCOME
100.0/ 100
METRIC RATING
38th/ 347
METRIC RANK
$82,386
MEDIAN FAMILY INCOME
0.0/ 100
METRIC RATING
325th/ 347
METRIC RANK

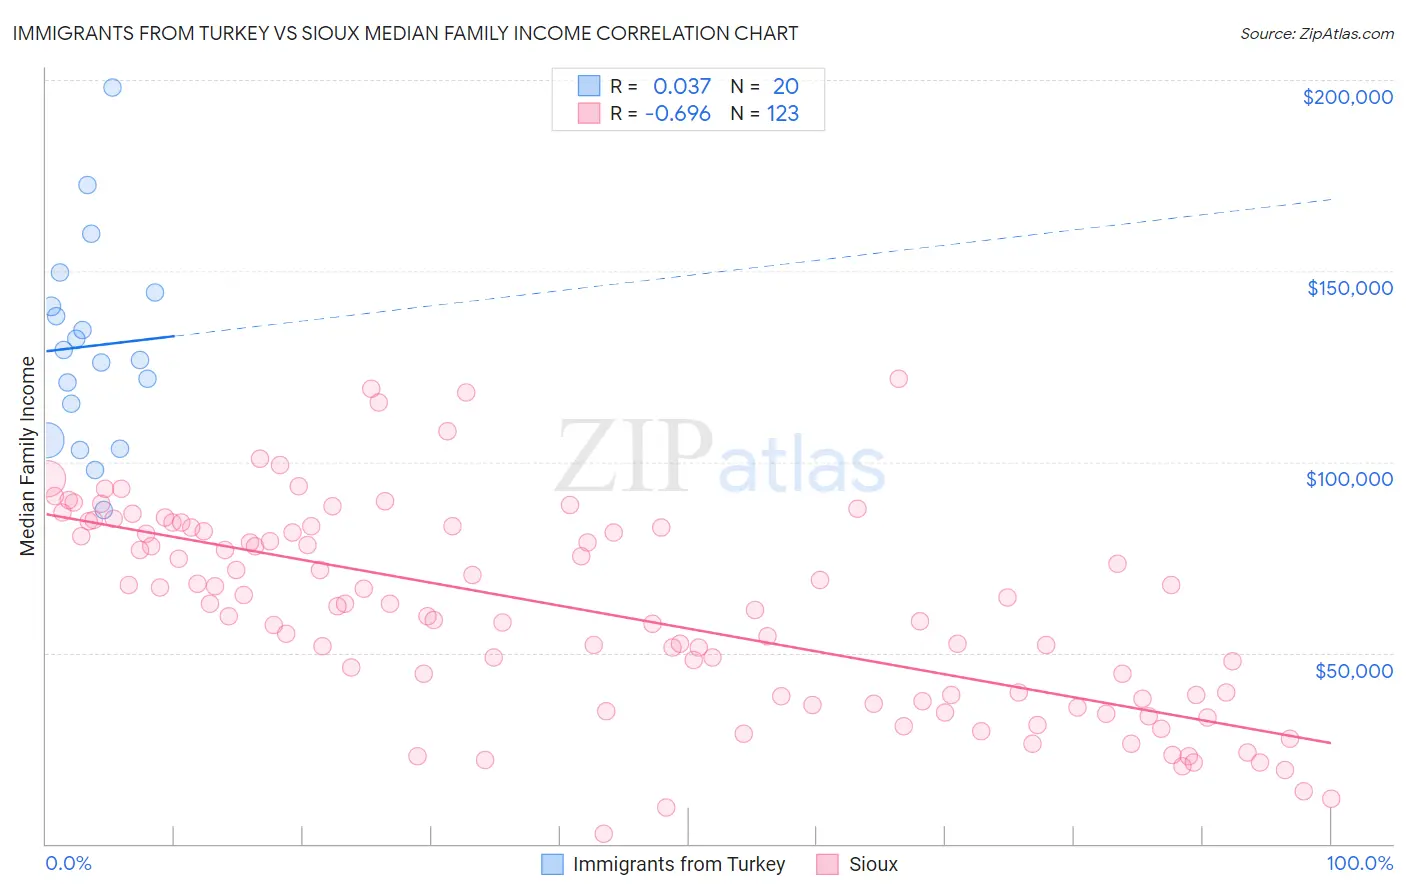
Immigrants from Turkey vs Sioux Median Family Income Correlation Chart

The statistical analysis conducted on geographies consisting of 222,914,261 people shows no correlation between the proportion of Immigrants from Turkey and median family income in the United States with a correlation coefficient (R) of 0.037 and weighted average of $118,325. Similarly, the statistical analysis conducted on geographies consisting of 234,054,236 people shows a significant negative correlation between the proportion of Sioux and median family income in the United States with a correlation coefficient (R) of -0.696 and weighted average of $82,386, a difference of 43.6%.
Immigrants from Turkey vs Sioux Median Family Income

Median Family Income Correlation Summary

MeasurementImmigrants from TurkeySioux
Minimum$87,281$2,499
Maximum$197,922$121,875
Range$110,641$119,376
Mean$130,330$60,906
Median$128,029$62,832
Interquartile 25% (IQ1)$110,406$37,821
Interquartile 75% (IQ3)$142,421$82,841
Interquartile Range (IQR)$32,015$45,020
Standard Deviation (Sample)$26,517$26,471
Standard Deviation (Population)$25,846$26,363

Similar Demographics by Median Family Income

Demographics Similar to Immigrants from Turkey by Median Family Income

In terms of median family income, the demographic groups most similar to Immigrants from Turkey are Immigrants from Asia ($118,291, a difference of 0.030%), Australian ($118,440, a difference of 0.10%), Israeli ($118,577, a difference of 0.21%), Immigrants from Lithuania ($118,053, a difference of 0.23%), and Estonian ($118,013, a difference of 0.26%).
DemographicsRating | RankMedian Family Income
Immigrants | France
100.0
/100
|
#31
Exceptional
$120,076
Asians
100.0
/100
|
#32
Exceptional
$119,955
Bhutanese
100.0
/100
|
#33
Exceptional
$119,800
Bolivians
100.0
/100
|
#34
Exceptional
$119,479
Soviet Union
100.0
/100
|
#35
Exceptional
$119,262
Israelis
100.0
/100
|
#36
Exceptional
$118,577
Australians
100.0
/100
|
#37
Exceptional
$118,440
Immigrants | Turkey
100.0
/100
|
#38
Exceptional
$118,325
Immigrants | Asia
100.0
/100
|
#39
Exceptional
$118,291
Immigrants | Lithuania
100.0
/100
|
#40
Exceptional
$118,053
Estonians
100.0
/100
|
#41
Exceptional
$118,013
Immigrants | Bolivia
100.0
/100
|
#42
Exceptional
$117,912
Bulgarians
100.0
/100
|
#43
Exceptional
$117,818
Cambodians
100.0
/100
|
#44
Exceptional
$117,780
Immigrants | Greece
99.9
/100
|
#45
Exceptional
$117,344

Demographics Similar to Sioux by Median Family Income

In terms of median family income, the demographic groups most similar to Sioux are Creek ($82,560, a difference of 0.21%), Immigrants from Congo ($82,216, a difference of 0.21%), Bahamian ($82,631, a difference of 0.30%), Arapaho ($82,064, a difference of 0.39%), and Black/African American ($81,912, a difference of 0.58%).
DemographicsRating | RankMedian Family Income
Immigrants | Mexico
0.0
/100
|
#318
Tragic
$83,639
Immigrants | Honduras
0.0
/100
|
#319
Tragic
$83,618
Seminole
0.0
/100
|
#320
Tragic
$83,354
Immigrants | Caribbean
0.0
/100
|
#321
Tragic
$83,319
Dominicans
0.0
/100
|
#322
Tragic
$82,888
Bahamians
0.0
/100
|
#323
Tragic
$82,631
Creek
0.0
/100
|
#324
Tragic
$82,560
Sioux
0.0
/100
|
#325
Tragic
$82,386
Immigrants | Congo
0.0
/100
|
#326
Tragic
$82,216
Arapaho
0.0
/100
|
#327
Tragic
$82,064
Blacks/African Americans
0.0
/100
|
#328
Tragic
$81,912
Dutch West Indians
0.0
/100
|
#329
Tragic
$81,852
Cheyenne
0.0
/100
|
#330
Tragic
$81,385
Immigrants | Dominican Republic
0.0
/100
|
#331
Tragic
$81,233
Natives/Alaskans
0.0
/100
|
#332
Tragic
$80,908