Immigrants from Turkey vs Peruvian Median Family Income
COMPARE
Immigrants from Turkey
Peruvian
Median Family Income
Median Family Income Comparison
Immigrants from Turkey
Peruvians
$118,325
MEDIAN FAMILY INCOME
100.0/ 100
METRIC RATING
38th/ 347
METRIC RANK
$105,444
MEDIAN FAMILY INCOME
80.4/ 100
METRIC RATING
151st/ 347
METRIC RANK
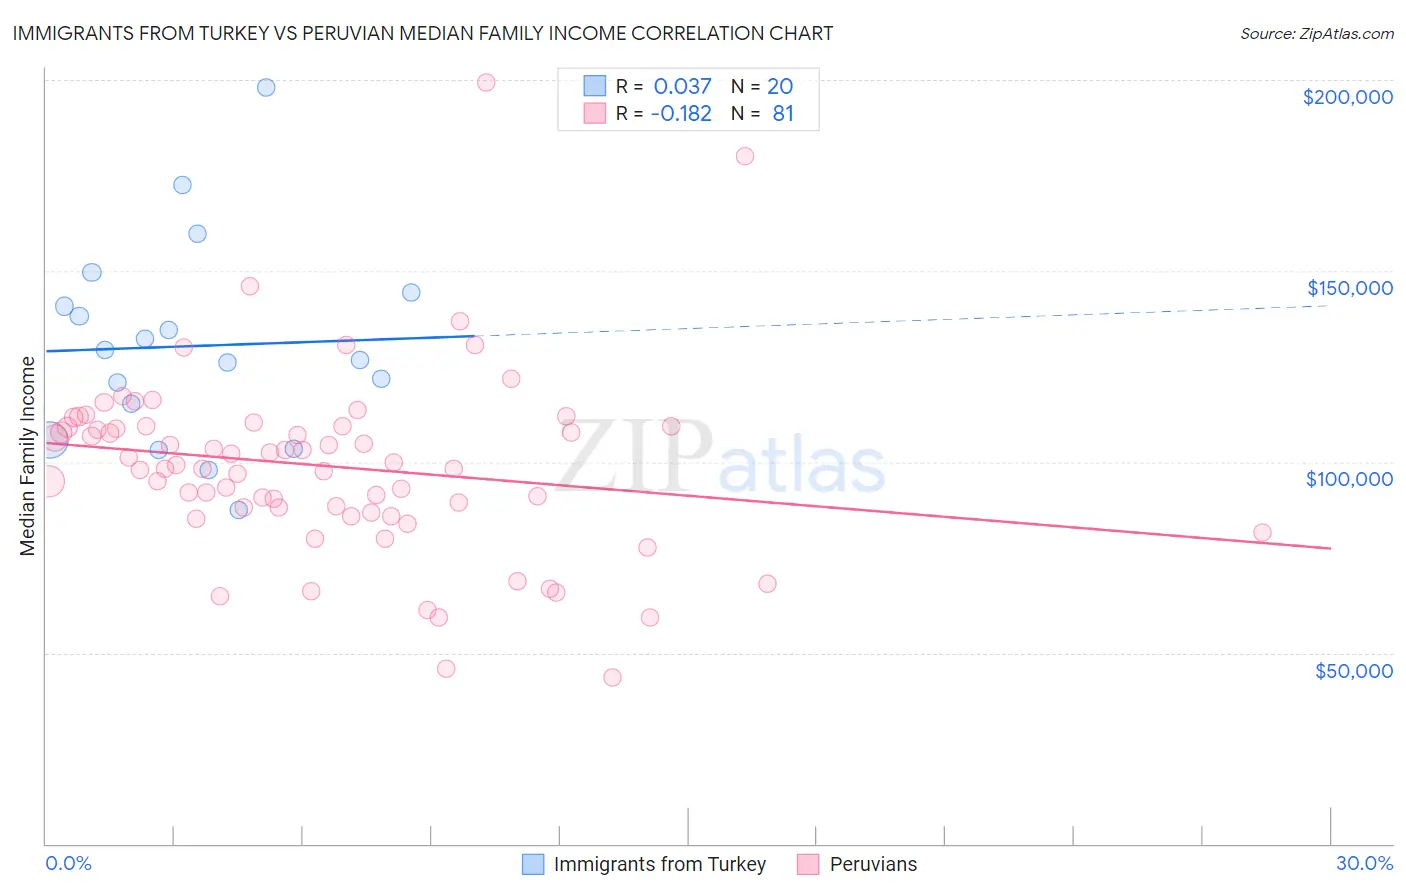
Immigrants from Turkey vs Peruvian Median Family Income Correlation Chart
The statistical analysis conducted on geographies consisting of 222,914,261 people shows no correlation between the proportion of Immigrants from Turkey and median family income in the United States with a correlation coefficient (R) of 0.037 and weighted average of $118,325. Similarly, the statistical analysis conducted on geographies consisting of 362,843,990 people shows a poor negative correlation between the proportion of Peruvians and median family income in the United States with a correlation coefficient (R) of -0.182 and weighted average of $105,444, a difference of 12.2%.
Median Family Income Correlation Summary
| Measurement | Immigrants from Turkey | Peruvian |
| Minimum | $87,281 | $43,482 |
| Maximum | $197,922 | $199,297 |
| Range | $110,641 | $155,815 |
| Mean | $130,330 | $98,972 |
| Median | $128,029 | $99,243 |
| Interquartile 25% (IQ1) | $110,406 | $87,340 |
| Interquartile 75% (IQ3) | $142,421 | $109,266 |
| Interquartile Range (IQR) | $32,015 | $21,927 |
| Standard Deviation (Sample) | $26,517 | $24,295 |
| Standard Deviation (Population) | $25,846 | $24,144 |
Similar Demographics by Median Family Income
Demographics Similar to Immigrants from Turkey by Median Family Income
In terms of median family income, the demographic groups most similar to Immigrants from Turkey are Immigrants from Asia ($118,291, a difference of 0.030%), Australian ($118,440, a difference of 0.10%), Israeli ($118,577, a difference of 0.21%), Immigrants from Lithuania ($118,053, a difference of 0.23%), and Estonian ($118,013, a difference of 0.26%).
| Demographics | Rating | Rank | Median Family Income |
| Immigrants | France | 100.0 /100 | #31 | Exceptional $120,076 |
| Asians | 100.0 /100 | #32 | Exceptional $119,955 |
| Bhutanese | 100.0 /100 | #33 | Exceptional $119,800 |
| Bolivians | 100.0 /100 | #34 | Exceptional $119,479 |
| Soviet Union | 100.0 /100 | #35 | Exceptional $119,262 |
| Israelis | 100.0 /100 | #36 | Exceptional $118,577 |
| Australians | 100.0 /100 | #37 | Exceptional $118,440 |
| Immigrants | Turkey | 100.0 /100 | #38 | Exceptional $118,325 |
| Immigrants | Asia | 100.0 /100 | #39 | Exceptional $118,291 |
| Immigrants | Lithuania | 100.0 /100 | #40 | Exceptional $118,053 |
| Estonians | 100.0 /100 | #41 | Exceptional $118,013 |
| Immigrants | Bolivia | 100.0 /100 | #42 | Exceptional $117,912 |
| Bulgarians | 100.0 /100 | #43 | Exceptional $117,818 |
| Cambodians | 100.0 /100 | #44 | Exceptional $117,780 |
| Immigrants | Greece | 99.9 /100 | #45 | Exceptional $117,344 |
Demographics Similar to Peruvians by Median Family Income
In terms of median family income, the demographic groups most similar to Peruvians are Irish ($105,453, a difference of 0.010%), Immigrants from Germany ($105,507, a difference of 0.060%), Immigrants from Albania ($105,285, a difference of 0.15%), Hungarian ($105,609, a difference of 0.16%), and Immigrants from Chile ($105,655, a difference of 0.20%).
| Demographics | Rating | Rank | Median Family Income |
| Immigrants | Morocco | 84.3 /100 | #144 | Excellent $105,964 |
| Danes | 83.8 /100 | #145 | Excellent $105,900 |
| Czechs | 83.4 /100 | #146 | Excellent $105,839 |
| Immigrants | Chile | 82.1 /100 | #147 | Excellent $105,655 |
| Hungarians | 81.7 /100 | #148 | Excellent $105,609 |
| Immigrants | Germany | 80.9 /100 | #149 | Excellent $105,507 |
| Irish | 80.5 /100 | #150 | Excellent $105,453 |
| Peruvians | 80.4 /100 | #151 | Excellent $105,444 |
| Immigrants | Albania | 79.1 /100 | #152 | Good $105,285 |
| Slavs | 77.9 /100 | #153 | Good $105,144 |
| Immigrants | Nepal | 76.3 /100 | #154 | Good $104,966 |
| Native Hawaiians | 75.8 /100 | #155 | Good $104,910 |
| Basques | 74.4 /100 | #156 | Good $104,760 |
| Moroccans | 71.6 /100 | #157 | Good $104,488 |
| Scandinavians | 70.8 /100 | #158 | Good $104,410 |