Immigrants from Turkey vs White/Caucasian In Labor Force | Age 25-29
COMPARE
Immigrants from Turkey
White/Caucasian
In Labor Force | Age 25-29
In Labor Force | Age 25-29 Comparison
Immigrants from Turkey
Whites/Caucasians
85.4%
IN LABOR FORCE | AGE 25-29
99.2/ 100
METRIC RATING
67th/ 347
METRIC RANK
84.2%
IN LABOR FORCE | AGE 25-29
4.8/ 100
METRIC RATING
230th/ 347
METRIC RANK
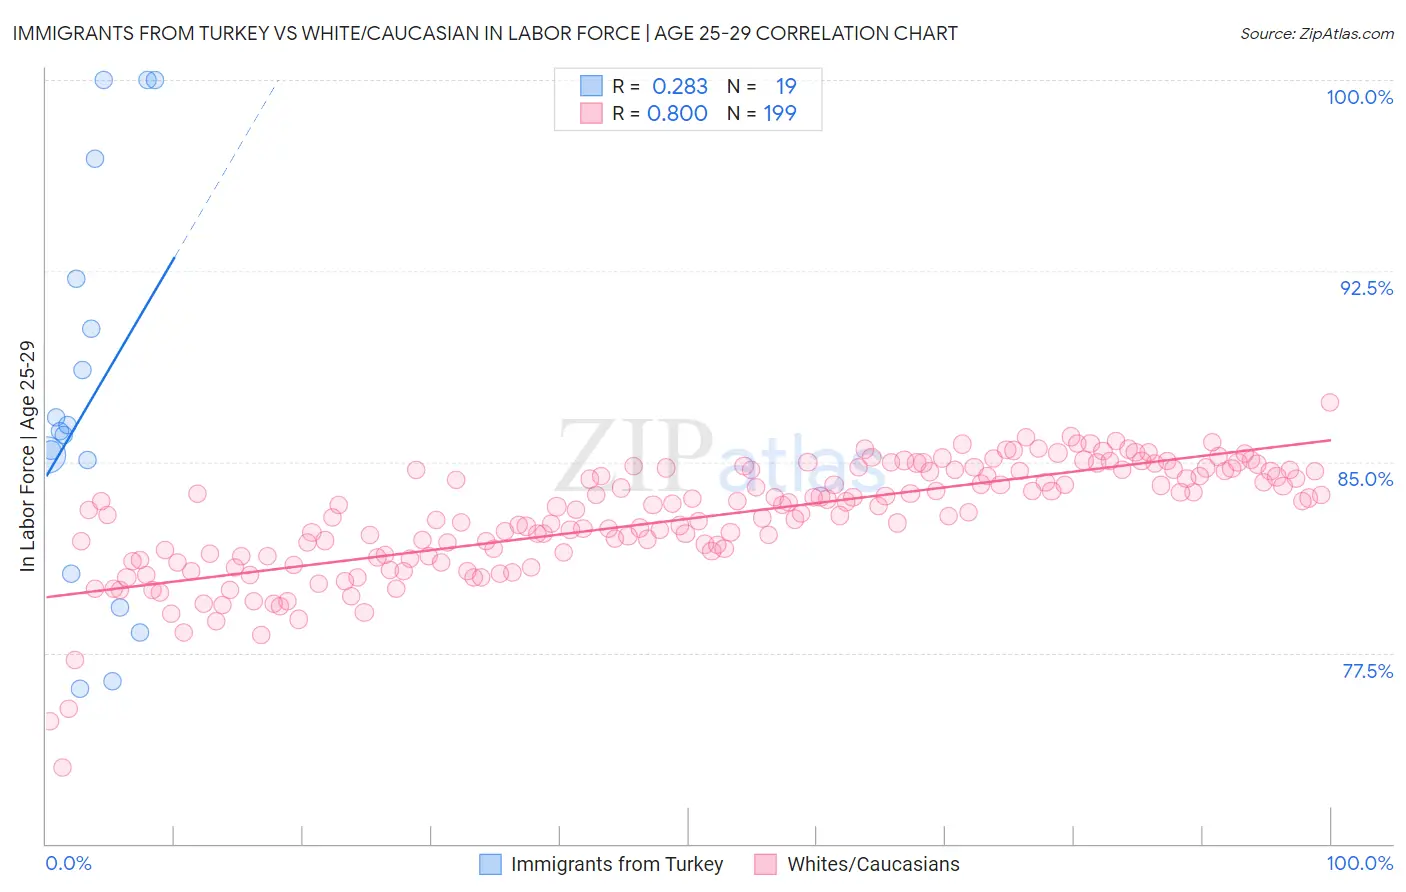
Immigrants from Turkey vs White/Caucasian In Labor Force | Age 25-29 Correlation Chart
The statistical analysis conducted on geographies consisting of 223,033,293 people shows a weak positive correlation between the proportion of Immigrants from Turkey and labor force participation rate among population between the ages 25 and 29 in the United States with a correlation coefficient (R) of 0.283 and weighted average of 85.4%. Similarly, the statistical analysis conducted on geographies consisting of 582,492,747 people shows a strong positive correlation between the proportion of Whites/Caucasians and labor force participation rate among population between the ages 25 and 29 in the United States with a correlation coefficient (R) of 0.800 and weighted average of 84.2%, a difference of 1.5%.
In Labor Force | Age 25-29 Correlation Summary
| Measurement | Immigrants from Turkey | White/Caucasian |
| Minimum | 76.1% | 73.0% |
| Maximum | 100.0% | 87.3% |
| Range | 23.9% | 14.3% |
| Mean | 87.4% | 82.8% |
| Median | 86.2% | 83.2% |
| Interquartile 25% (IQ1) | 80.6% | 81.3% |
| Interquartile 75% (IQ3) | 92.2% | 84.6% |
| Interquartile Range (IQR) | 11.6% | 3.3% |
| Standard Deviation (Sample) | 7.7% | 2.2% |
| Standard Deviation (Population) | 7.5% | 2.2% |
Similar Demographics by In Labor Force | Age 25-29
Demographics Similar to Immigrants from Turkey by In Labor Force | Age 25-29
In terms of in labor force | age 25-29, the demographic groups most similar to Immigrants from Turkey are Immigrants from Scotland (85.4%, a difference of 0.010%), Immigrants from Cameroon (85.4%, a difference of 0.010%), Immigrants from Italy (85.4%, a difference of 0.020%), Immigrants from Czechoslovakia (85.4%, a difference of 0.020%), and Menominee (85.4%, a difference of 0.030%).
| Demographics | Rating | Rank | In Labor Force | Age 25-29 |
| Thais | 99.5 /100 | #60 | Exceptional 85.5% |
| Serbians | 99.5 /100 | #61 | Exceptional 85.5% |
| Taiwanese | 99.4 /100 | #62 | Exceptional 85.4% |
| Immigrants | Kenya | 99.4 /100 | #63 | Exceptional 85.4% |
| Immigrants | Italy | 99.3 /100 | #64 | Exceptional 85.4% |
| Immigrants | Czechoslovakia | 99.3 /100 | #65 | Exceptional 85.4% |
| Immigrants | Scotland | 99.3 /100 | #66 | Exceptional 85.4% |
| Immigrants | Turkey | 99.2 /100 | #67 | Exceptional 85.4% |
| Immigrants | Cameroon | 99.2 /100 | #68 | Exceptional 85.4% |
| Menominee | 99.1 /100 | #69 | Exceptional 85.4% |
| Immigrants | Sweden | 99.1 /100 | #70 | Exceptional 85.4% |
| Kenyans | 99.0 /100 | #71 | Exceptional 85.4% |
| Immigrants | Australia | 98.9 /100 | #72 | Exceptional 85.3% |
| Russians | 98.8 /100 | #73 | Exceptional 85.3% |
| Soviet Union | 98.5 /100 | #74 | Exceptional 85.3% |
Demographics Similar to Whites/Caucasians by In Labor Force | Age 25-29
In terms of in labor force | age 25-29, the demographic groups most similar to Whites/Caucasians are Immigrants from Oceania (84.2%, a difference of 0.0%), Immigrants from Philippines (84.2%, a difference of 0.010%), Panamanian (84.2%, a difference of 0.010%), French American Indian (84.2%, a difference of 0.020%), and Immigrants from Panama (84.2%, a difference of 0.020%).
| Demographics | Rating | Rank | In Labor Force | Age 25-29 |
| Scotch-Irish | 6.5 /100 | #223 | Tragic 84.2% |
| Immigrants | West Indies | 6.0 /100 | #224 | Tragic 84.2% |
| Koreans | 5.9 /100 | #225 | Tragic 84.2% |
| Immigrants | Congo | 5.8 /100 | #226 | Tragic 84.2% |
| French American Indians | 5.5 /100 | #227 | Tragic 84.2% |
| Immigrants | Panama | 5.5 /100 | #228 | Tragic 84.2% |
| Immigrants | Oceania | 5.0 /100 | #229 | Tragic 84.2% |
| Whites/Caucasians | 4.8 /100 | #230 | Tragic 84.2% |
| Immigrants | Philippines | 4.7 /100 | #231 | Tragic 84.2% |
| Panamanians | 4.5 /100 | #232 | Tragic 84.2% |
| Immigrants | Western Asia | 2.7 /100 | #233 | Tragic 84.1% |
| Barbadians | 1.0 /100 | #234 | Tragic 83.9% |
| Iraqis | 0.9 /100 | #235 | Tragic 83.9% |
| Guamanians/Chamorros | 0.9 /100 | #236 | Tragic 83.9% |
| Immigrants | Immigrants | 0.9 /100 | #237 | Tragic 83.9% |