Immigrants from Thailand vs Iraqi Median Household Income
COMPARE
Immigrants from Thailand
Iraqi
Median Household Income
Median Household Income Comparison
Immigrants from Thailand
Iraqis
$83,327
MEDIAN HOUSEHOLD INCOME
24.3/ 100
METRIC RATING
202nd/ 347
METRIC RANK
$83,753
MEDIAN HOUSEHOLD INCOME
29.6/ 100
METRIC RATING
191st/ 347
METRIC RANK
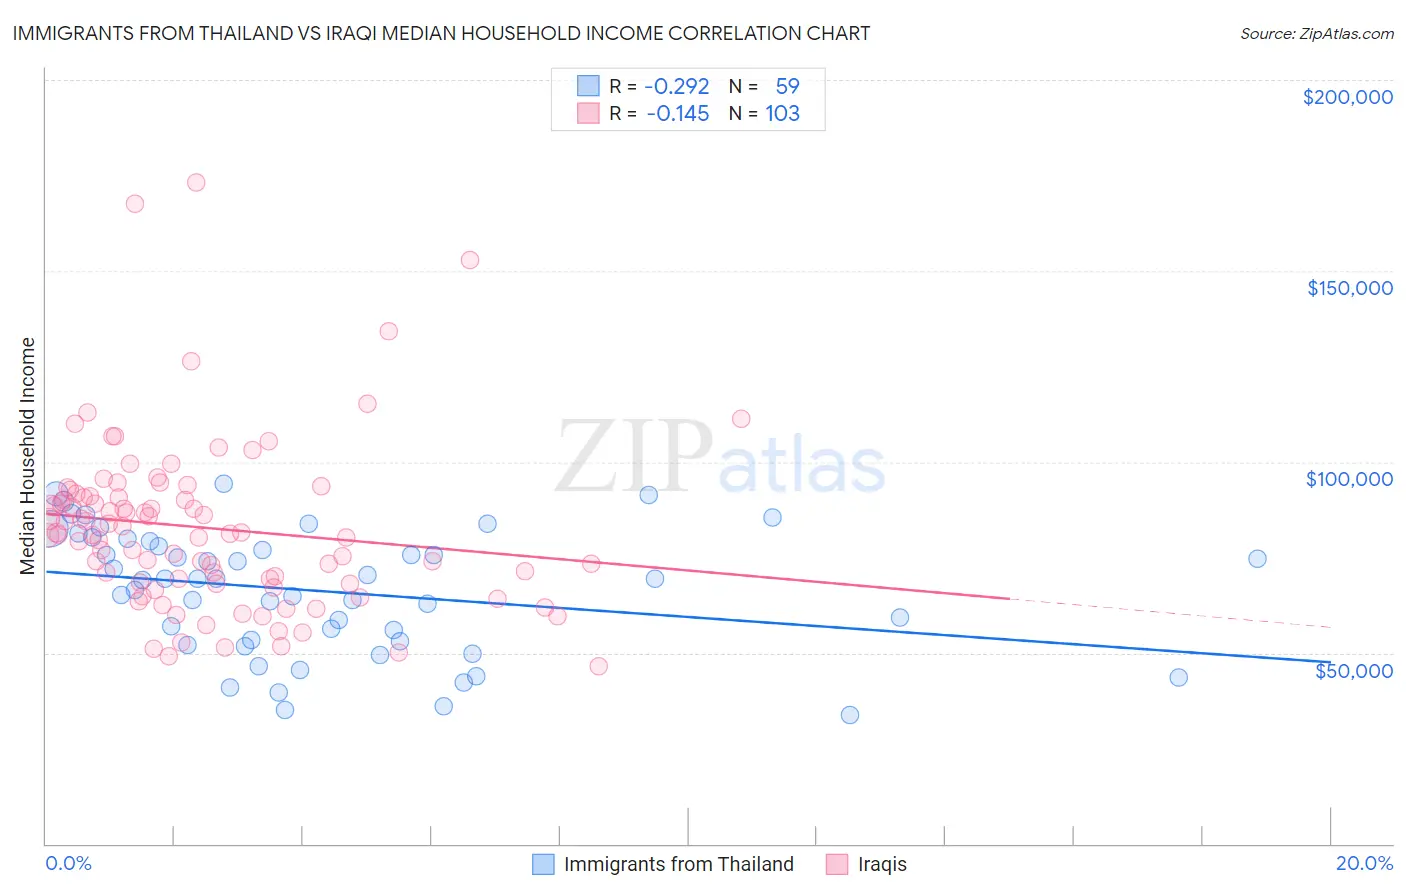
Immigrants from Thailand vs Iraqi Median Household Income Correlation Chart
The statistical analysis conducted on geographies consisting of 316,905,677 people shows a weak negative correlation between the proportion of Immigrants from Thailand and median household income in the United States with a correlation coefficient (R) of -0.292 and weighted average of $83,327. Similarly, the statistical analysis conducted on geographies consisting of 170,587,047 people shows a poor negative correlation between the proportion of Iraqis and median household income in the United States with a correlation coefficient (R) of -0.145 and weighted average of $83,753, a difference of 0.51%.
Median Household Income Correlation Summary
| Measurement | Immigrants from Thailand | Iraqi |
| Minimum | $33,750 | $46,565 |
| Maximum | $94,169 | $173,015 |
| Range | $60,419 | $126,450 |
| Mean | $66,115 | $82,738 |
| Median | $69,375 | $81,250 |
| Interquartile 25% (IQ1) | $53,069 | $68,093 |
| Interquartile 75% (IQ3) | $79,311 | $91,098 |
| Interquartile Range (IQR) | $26,242 | $23,005 |
| Standard Deviation (Sample) | $16,097 | $22,309 |
| Standard Deviation (Population) | $15,960 | $22,201 |
Demographics Similar to Immigrants from Thailand and Iraqis by Median Household Income
In terms of median household income, the demographic groups most similar to Immigrants from Thailand are Tsimshian ($83,346, a difference of 0.020%), Spanish ($83,343, a difference of 0.020%), Immigrants from Cambodia ($83,304, a difference of 0.030%), German ($83,358, a difference of 0.040%), and Immigrants from Africa ($83,289, a difference of 0.050%). Similarly, the demographic groups most similar to Iraqis are Slovak ($83,798, a difference of 0.050%), Welsh ($83,628, a difference of 0.15%), Immigrants from Colombia ($83,902, a difference of 0.18%), Finnish ($83,607, a difference of 0.18%), and Ghanaian ($83,582, a difference of 0.21%).
| Demographics | Rating | Rank | Median Household Income |
| Puget Sound Salish | 33.2 /100 | #186 | Fair $84,011 |
| Belgians | 33.2 /100 | #187 | Fair $84,008 |
| Tlingit-Haida | 32.6 /100 | #188 | Fair $83,968 |
| Immigrants | Colombia | 31.7 /100 | #189 | Fair $83,902 |
| Slovaks | 30.2 /100 | #190 | Fair $83,798 |
| Iraqis | 29.6 /100 | #191 | Fair $83,753 |
| Welsh | 28.0 /100 | #192 | Fair $83,628 |
| Finns | 27.7 /100 | #193 | Fair $83,607 |
| Ghanaians | 27.4 /100 | #194 | Fair $83,582 |
| Immigrants | Armenia | 27.0 /100 | #195 | Fair $83,555 |
| French | 26.0 /100 | #196 | Fair $83,468 |
| Aleuts | 25.7 /100 | #197 | Fair $83,446 |
| Japanese | 25.1 /100 | #198 | Fair $83,395 |
| Germans | 24.6 /100 | #199 | Fair $83,358 |
| Tsimshian | 24.5 /100 | #200 | Fair $83,346 |
| Spanish | 24.4 /100 | #201 | Fair $83,343 |
| Immigrants | Thailand | 24.3 /100 | #202 | Fair $83,327 |
| Immigrants | Cambodia | 24.0 /100 | #203 | Fair $83,304 |
| Immigrants | Africa | 23.8 /100 | #204 | Fair $83,289 |
| Celtics | 22.7 /100 | #205 | Fair $83,193 |
| Immigrants | Kenya | 21.3 /100 | #206 | Fair $83,068 |