Immigrants from Jordan vs Palestinian Householder Income Ages 25 - 44 years

COMPARE

Immigrants from Jordan
Race
Ancestry
AfghanAfricanAlaska NativeAlaskan AthabascanAlbanianAleutAlsatianAmericanApacheArabArapahoArgentineanArmenianAssyrian/Chaldean/SyriacAustralianAustrianBahamianBangladeshiBarbadianBasqueBelgianBelizeanBermudanBhutaneseBlackfeetBolivianBrazilianBritishBritish West IndianBulgarianBurmeseCajunCambodianCanadianCape VerdeanCarpatho RusynCelticCentral AmericanCentral American IndianCherokeeCheyenneChickasawChileanChineseChippewaChoctawColombianColvilleComancheCosta RicanCreeCreekCroatianCrowCubanCypriotCzechCzechoslovakianDanishDelawareDominicanDutchDutch West IndianEastern EuropeanEcuadorianEgyptianEnglishEstonianEthiopianEuropeanFijianFilipinoFinnishFrenchFrench American IndianFrench CanadianGermanGerman RussianGhanaianGreekGuamanian/ChamorroGuatemalanGuyaneseHaitianHmongHonduranHopiHoumaHungarianIcelanderIndian (Asian)IndonesianInupiatIranianIraqiIrishIroquoisIsraeliItalianJamaicanJapaneseJordanianKenyanKiowaKoreanLaotianLatvianLebaneseLiberianLithuanianLumbeeLuxembourgerMacedonianMalaysianMalteseMarshalleseMenomineeMexicanMexican American IndianMongolianMoroccanNative HawaiianNavajoNepaleseNew ZealanderNicaraguanNigerianNorthern EuropeanNorwegianOkinawanOsageOttawaPaiutePakistaniPanamanianParaguayanPennsylvania GermanPeruvianPimaPolishPortuguesePotawatomiPuebloPuerto RicanPuget Sound SalishRomanianRussianSalvadoranSamoanScandinavianScotch-IrishScottishSeminoleSenegaleseSerbianShoshoneSierra LeoneanSiouxSlavicSlovakSloveneSomaliSouth AfricanSouth AmericanSouth American IndianSoviet UnionSpaniardSpanishSpanish AmericanSpanish American IndianSri LankanSubsaharan AfricanSudaneseSwedishSwissSyrianTaiwaneseThaiTlingit-HaidaTohono O'OdhamTonganTrinidadian and TobagonianTsimshianTurkishU.S. Virgin IslanderUgandanUkrainianUruguayanUteVenezuelanVietnameseWelshWest IndianYakamaYaquiYugoslavianYumanYup'ikZimbabwean
Immigration
NonimmigrantsImmigrantsAfghanistanAfricaAlbaniaArgentinaArmeniaAsiaAustraliaAustriaBahamasBangladeshBarbadosBelarusBelgiumBelizeBoliviaBosnia and HerzegovinaBrazilBulgariaBurma/MyanmarCabo VerdeCambodiaCameroonCanadaCaribbeanCentral AmericaChileChinaColombiaCongoCosta RicaCroatiaCubaCzechoslovakiaDenmarkDominicaDominican RepublicEastern AfricaEastern AsiaEastern EuropeEcuadorEgyptEl SalvadorEnglandEritreaEthiopiaEuropeFijiFranceGermanyGhanaGreeceGrenadaGuatemalaGuyanaHaitiHondurasHong KongHungaryIndiaIndonesiaIranIraqIrelandIsraelItalyJamaicaJapanJordanKazakhstanKenyaKoreaKuwaitLaosLatin AmericaLatviaLebanonLiberiaLithuaniaMalaysiaMexicoMicronesiaMiddle AfricaMoldovaMoroccoNepalNetherlandsNicaraguaNigeriaNorth AmericaNorth MacedoniaNorthern AfricaNorthern EuropeNorwayOceaniaPakistanPanamaPeruPhilippinesPolandPortugalRomaniaRussiaSaudi ArabiaScotlandSenegalSerbiaSierra LeoneSingaporeSomaliaSouth AfricaSouth AmericaSouth Central AsiaSouth Eastern AsiaSouthern EuropeSpainSri LankaSt. Vincent and the GrenadinesSudanSwedenSwitzerlandSyriaTaiwanThailandTrinidad and TobagoTurkeyUgandaUkraineUruguayUzbekistanVenezuelaVietnamWest IndiesWestern AfricaWestern AsiaWestern EuropeYemenZaireZimbabweAzores
Palestinian
Race
Ancestry
AfghanAfricanAlaska NativeAlaskan AthabascanAlbanianAleutAlsatianAmericanApacheArabArapahoArgentineanArmenianAssyrian/Chaldean/SyriacAustralianAustrianBahamianBangladeshiBarbadianBasqueBelgianBelizeanBermudanBhutaneseBlackfeetBolivianBrazilianBritishBritish West IndianBulgarianBurmeseCajunCambodianCanadianCape VerdeanCarpatho RusynCelticCentral AmericanCentral American IndianCherokeeCheyenneChickasawChileanChineseChippewaChoctawColombianColvilleComancheCosta RicanCreeCreekCroatianCrowCubanCypriotCzechCzechoslovakianDanishDelawareDominicanDutchDutch West IndianEastern EuropeanEcuadorianEgyptianEnglishEstonianEthiopianEuropeanFijianFilipinoFinnishFrenchFrench American IndianFrench CanadianGermanGerman RussianGhanaianGreekGuamanian/ChamorroGuatemalanGuyaneseHaitianHmongHonduranHopiHoumaHungarianIcelanderIndian (Asian)IndonesianInupiatIranianIraqiIrishIroquoisIsraeliItalianJamaicanJapaneseJordanianKenyanKiowaKoreanLaotianLatvianLebaneseLiberianLithuanianLumbeeLuxembourgerMacedonianMalaysianMalteseMarshalleseMenomineeMexicanMexican American IndianMongolianMoroccanNative HawaiianNavajoNepaleseNew ZealanderNicaraguanNigerianNorthern EuropeanNorwegianOkinawanOsageOttawaPaiutePakistaniPalestinianPanamanianParaguayanPennsylvania GermanPeruvianPimaPolishPortuguesePotawatomiPuebloPuerto RicanPuget Sound SalishRomanianRussianSalvadoranSamoanScandinavianScotch-IrishScottishSeminoleSenegaleseSerbianShoshoneSierra LeoneanSiouxSlavicSlovakSloveneSomaliSouth AfricanSouth AmericanSouth American IndianSoviet UnionSpaniardSpanishSpanish AmericanSpanish American IndianSri LankanSubsaharan AfricanSudaneseSwedishSwissSyrianTaiwaneseThaiTlingit-HaidaTohono O'OdhamTonganTrinidadian and TobagonianTsimshianTurkishU.S. Virgin IslanderUgandanUkrainianUruguayanUteVenezuelanVietnameseWelshWest IndianYakamaYaquiYugoslavianYumanYup'ikZimbabwean
Immigration
NonimmigrantsImmigrantsAfghanistanAfricaAlbaniaArgentinaArmeniaAsiaAustraliaAustriaBahamasBangladeshBarbadosBelarusBelgiumBelizeBoliviaBosnia and HerzegovinaBrazilBulgariaBurma/MyanmarCabo VerdeCambodiaCameroonCanadaCaribbeanCentral AmericaChileChinaColombiaCongoCosta RicaCroatiaCubaCzechoslovakiaDenmarkDominicaDominican RepublicEastern AfricaEastern AsiaEastern EuropeEcuadorEgyptEl SalvadorEnglandEritreaEthiopiaEuropeFijiFranceGermanyGhanaGreeceGrenadaGuatemalaGuyanaHaitiHondurasHong KongHungaryIndiaIndonesiaIranIraqIrelandIsraelItalyJamaicaJapanKazakhstanKenyaKoreaKuwaitLaosLatin AmericaLatviaLebanonLiberiaLithuaniaMalaysiaMexicoMicronesiaMiddle AfricaMoldovaMoroccoNepalNetherlandsNicaraguaNigeriaNorth AmericaNorth MacedoniaNorthern AfricaNorthern EuropeNorwayOceaniaPakistanPanamaPeruPhilippinesPolandPortugalRomaniaRussiaSaudi ArabiaScotlandSenegalSerbiaSierra LeoneSingaporeSomaliaSouth AfricaSouth AmericaSouth Central AsiaSouth Eastern AsiaSouthern EuropeSpainSri LankaSt. Vincent and the GrenadinesSudanSwedenSwitzerlandSyriaTaiwanThailandTrinidad and TobagoTurkeyUgandaUkraineUruguayUzbekistanVenezuelaVietnamWest IndiesWestern AfricaWestern AsiaWestern EuropeYemenZaireZimbabweAzores
Householder Income Ages 25 - 44 years
Income
Poverty
Unemployment
Labor Participation
Family Structure
Vehicle Availability
Education Level
Disability

Householder Income Ages 25 - 44 years Comparison

Immigrants from Jordan

Palestinians

Excellent
Exceptional
$97,185
HOUSEHOLDER INCOME AGES 25 - 44 YEARS
81.0/ 100
METRIC RATING
143rd/ 347
METRIC RANK
$98,777
HOUSEHOLDER INCOME AGES 25 - 44 YEARS
91.2/ 100
METRIC RATING
123rd/ 347
METRIC RANK

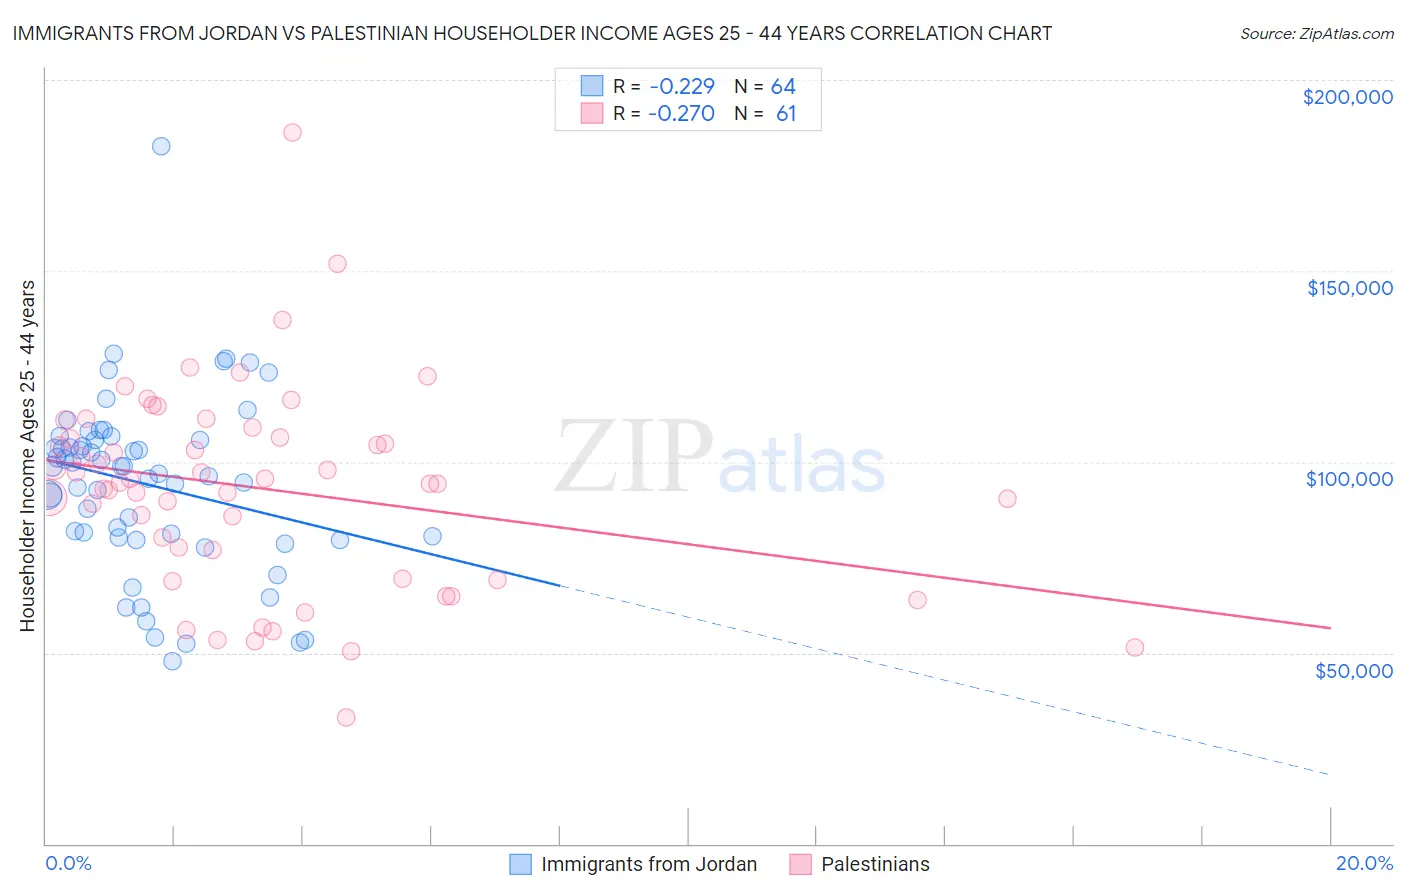
Immigrants from Jordan vs Palestinian Householder Income Ages 25 - 44 years Correlation Chart

The statistical analysis conducted on geographies consisting of 181,164,204 people shows a weak negative correlation between the proportion of Immigrants from Jordan and household income with householder between the ages 25 and 44 in the United States with a correlation coefficient (R) of -0.229 and weighted average of $97,185. Similarly, the statistical analysis conducted on geographies consisting of 216,290,532 people shows a weak negative correlation between the proportion of Palestinians and household income with householder between the ages 25 and 44 in the United States with a correlation coefficient (R) of -0.270 and weighted average of $98,777, a difference of 1.6%.
Immigrants from Jordan vs Palestinian Householder Income Ages 25 - 44 years

Householder Income Ages 25 - 44 years Correlation Summary

MeasurementImmigrants from JordanPalestinian
Minimum$47,644$33,077
Maximum$182,512$186,111
Range$134,868$153,034
Mean$94,069$93,023
Median$97,769$94,675
Interquartile 25% (IQ1)$80,422$73,167
Interquartile 75% (IQ3)$105,721$107,616
Interquartile Range (IQR)$25,299$34,449
Standard Deviation (Sample)$23,095$26,611
Standard Deviation (Population)$22,914$26,392

Demographics Similar to Immigrants from Jordan and Palestinians by Householder Income Ages 25 - 44 years

In terms of householder income ages 25 - 44 years, the demographic groups most similar to Immigrants from Jordan are Danish ($97,221, a difference of 0.040%), Luxembourger ($97,237, a difference of 0.050%), Immigrants from Morocco ($97,305, a difference of 0.12%), Immigrants from Peru ($97,329, a difference of 0.15%), and Lebanese ($97,339, a difference of 0.16%). Similarly, the demographic groups most similar to Palestinians are Zimbabwean ($98,586, a difference of 0.19%), Pakistani ($98,401, a difference of 0.38%), British ($98,359, a difference of 0.43%), Serbian ($98,320, a difference of 0.46%), and European ($98,310, a difference of 0.47%).
DemographicsRating | RankHouseholder Income Ages 25 - 44 years
Palestinians
91.2
/100
|
#123
Exceptional
$98,777
Zimbabweans
90.3
/100
|
#124
Exceptional
$98,586
Pakistanis
89.3
/100
|
#125
Excellent
$98,401
British
89.1
/100
|
#126
Excellent
$98,359
Serbians
88.9
/100
|
#127
Excellent
$98,320
Europeans
88.9
/100
|
#128
Excellent
$98,310
Brazilians
88.6
/100
|
#129
Excellent
$98,267
Immigrants | Kuwait
87.8
/100
|
#130
Excellent
$98,122
Immigrants | Albania
86.6
/100
|
#131
Excellent
$97,929
Immigrants | Zimbabwe
86.3
/100
|
#132
Excellent
$97,880
Tsimshian
85.8
/100
|
#133
Excellent
$97,809
Canadians
84.5
/100
|
#134
Excellent
$97,625
Immigrants | Oceania
84.5
/100
|
#135
Excellent
$97,623
Hungarians
83.9
/100
|
#136
Excellent
$97,544
Lebanese
82.3
/100
|
#137
Excellent
$97,339
Arabs
82.3
/100
|
#138
Excellent
$97,336
Immigrants | Peru
82.2
/100
|
#139
Excellent
$97,329
Immigrants | Morocco
82.0
/100
|
#140
Excellent
$97,305
Luxembourgers
81.5
/100
|
#141
Excellent
$97,237
Danes
81.3
/100
|
#142
Excellent
$97,221
Immigrants | Jordan
81.0
/100
|
#143
Excellent
$97,185