Immigrants from Colombia vs Palestinian Householder Income Ages 25 - 44 years
COMPARE
Immigrants from Colombia
Palestinian
Householder Income Ages 25 - 44 years
Householder Income Ages 25 - 44 years Comparison
Immigrants from Colombia
Palestinians
$92,204
HOUSEHOLDER INCOME AGES 25 - 44 YEARS
21.3/ 100
METRIC RATING
196th/ 347
METRIC RANK
$98,777
HOUSEHOLDER INCOME AGES 25 - 44 YEARS
91.2/ 100
METRIC RATING
123rd/ 347
METRIC RANK
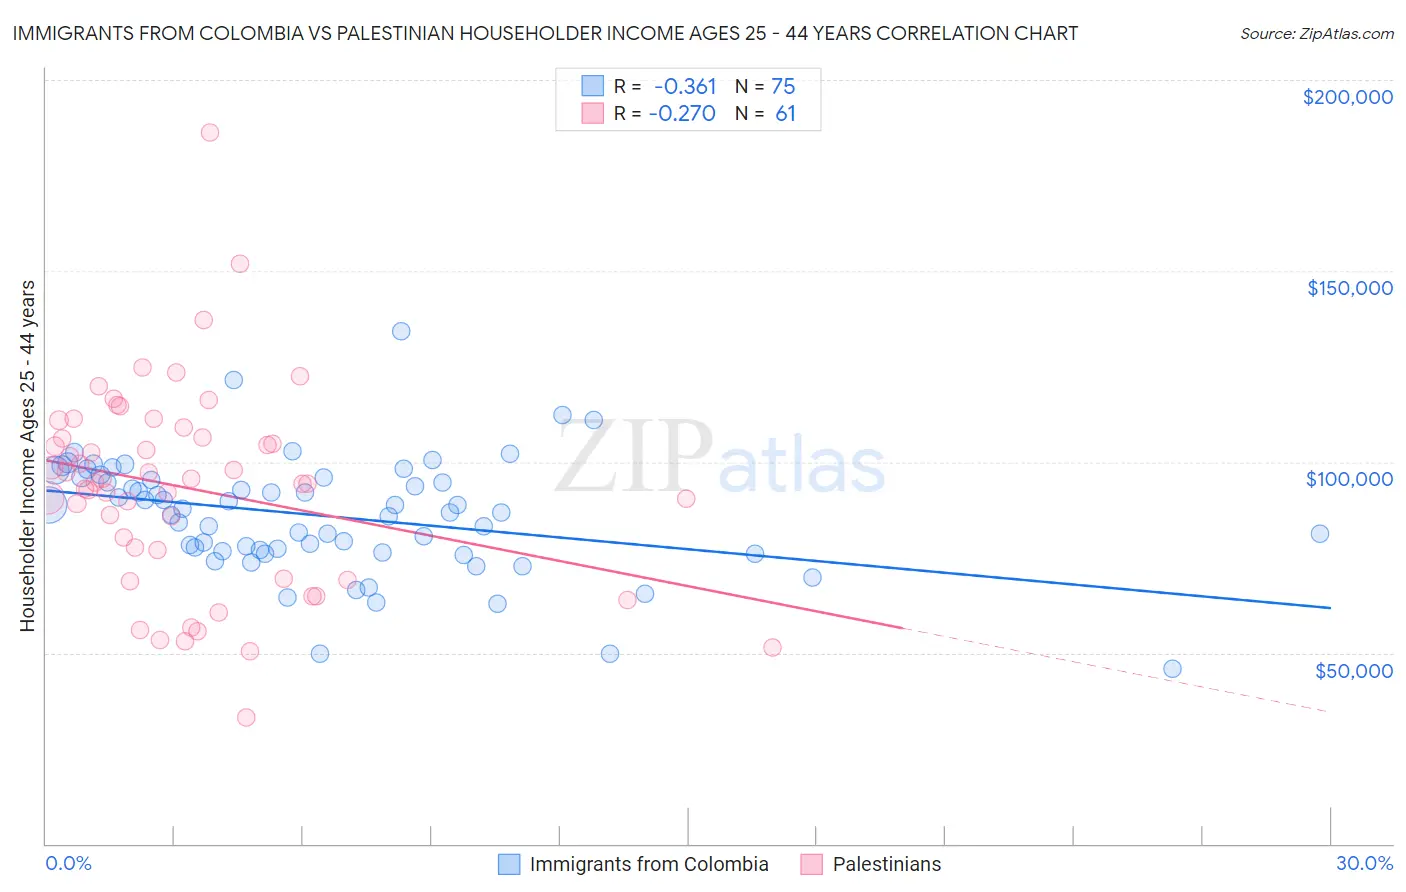
Immigrants from Colombia vs Palestinian Householder Income Ages 25 - 44 years Correlation Chart
The statistical analysis conducted on geographies consisting of 377,972,893 people shows a mild negative correlation between the proportion of Immigrants from Colombia and household income with householder between the ages 25 and 44 in the United States with a correlation coefficient (R) of -0.361 and weighted average of $92,204. Similarly, the statistical analysis conducted on geographies consisting of 216,290,532 people shows a weak negative correlation between the proportion of Palestinians and household income with householder between the ages 25 and 44 in the United States with a correlation coefficient (R) of -0.270 and weighted average of $98,777, a difference of 7.1%.
Householder Income Ages 25 - 44 years Correlation Summary
| Measurement | Immigrants from Colombia | Palestinian |
| Minimum | $45,673 | $33,077 |
| Maximum | $134,128 | $186,111 |
| Range | $88,455 | $153,034 |
| Mean | $85,778 | $93,023 |
| Median | $86,881 | $94,675 |
| Interquartile 25% (IQ1) | $76,505 | $73,167 |
| Interquartile 75% (IQ3) | $95,862 | $107,616 |
| Interquartile Range (IQR) | $19,357 | $34,449 |
| Standard Deviation (Sample) | $15,210 | $26,611 |
| Standard Deviation (Population) | $15,108 | $26,392 |
Similar Demographics by Householder Income Ages 25 - 44 years
Demographics Similar to Immigrants from Colombia by Householder Income Ages 25 - 44 years
In terms of householder income ages 25 - 44 years, the demographic groups most similar to Immigrants from Colombia are Spanish ($92,200, a difference of 0.0%), Celtic ($92,241, a difference of 0.040%), Vietnamese ($92,089, a difference of 0.12%), Immigrants from the Azores ($92,322, a difference of 0.13%), and Samoan ($92,385, a difference of 0.20%).
| Demographics | Rating | Rank | Householder Income Ages 25 - 44 years |
| Dutch | 30.5 /100 | #189 | Fair $93,081 |
| Welsh | 30.0 /100 | #190 | Fair $93,039 |
| Tlingit-Haida | 29.4 /100 | #191 | Fair $92,987 |
| Immigrants | Costa Rica | 28.2 /100 | #192 | Fair $92,876 |
| Samoans | 23.0 /100 | #193 | Fair $92,385 |
| Immigrants | Azores | 22.4 /100 | #194 | Fair $92,322 |
| Celtics | 21.6 /100 | #195 | Fair $92,241 |
| Immigrants | Colombia | 21.3 /100 | #196 | Fair $92,204 |
| Spanish | 21.2 /100 | #197 | Fair $92,200 |
| Vietnamese | 20.2 /100 | #198 | Fair $92,089 |
| Kenyans | 16.8 /100 | #199 | Poor $91,684 |
| Whites/Caucasians | 16.7 /100 | #200 | Poor $91,668 |
| Japanese | 16.4 /100 | #201 | Poor $91,624 |
| Ecuadorians | 16.0 /100 | #202 | Poor $91,574 |
| Immigrants | Cambodia | 15.7 /100 | #203 | Poor $91,533 |
Demographics Similar to Palestinians by Householder Income Ages 25 - 44 years
In terms of householder income ages 25 - 44 years, the demographic groups most similar to Palestinians are Immigrants from Uzbekistan ($98,849, a difference of 0.070%), Peruvian ($98,886, a difference of 0.11%), Zimbabwean ($98,586, a difference of 0.19%), Swedish ($99,136, a difference of 0.36%), and Pakistani ($98,401, a difference of 0.38%).
| Demographics | Rating | Rank | Householder Income Ages 25 - 44 years |
| Portuguese | 93.7 /100 | #116 | Exceptional $99,429 |
| Immigrants | Northern Africa | 93.0 /100 | #117 | Exceptional $99,232 |
| Syrians | 92.9 /100 | #118 | Exceptional $99,215 |
| Jordanians | 92.8 /100 | #119 | Exceptional $99,186 |
| Swedes | 92.7 /100 | #120 | Exceptional $99,136 |
| Peruvians | 91.7 /100 | #121 | Exceptional $98,886 |
| Immigrants | Uzbekistan | 91.5 /100 | #122 | Exceptional $98,849 |
| Palestinians | 91.2 /100 | #123 | Exceptional $98,777 |
| Zimbabweans | 90.3 /100 | #124 | Exceptional $98,586 |
| Pakistanis | 89.3 /100 | #125 | Excellent $98,401 |
| British | 89.1 /100 | #126 | Excellent $98,359 |
| Serbians | 88.9 /100 | #127 | Excellent $98,320 |
| Europeans | 88.9 /100 | #128 | Excellent $98,310 |
| Brazilians | 88.6 /100 | #129 | Excellent $98,267 |
| Immigrants | Kuwait | 87.8 /100 | #130 | Excellent $98,122 |