Immigrants from Switzerland vs Palestinian 4th Grade
COMPARE
Immigrants from Switzerland
Palestinian
4th Grade
4th Grade Comparison
Immigrants from Switzerland
Palestinians
97.8%
4TH GRADE
96.1/ 100
METRIC RATING
111th/ 347
METRIC RANK
97.7%
4TH GRADE
88.1/ 100
METRIC RATING
134th/ 347
METRIC RANK
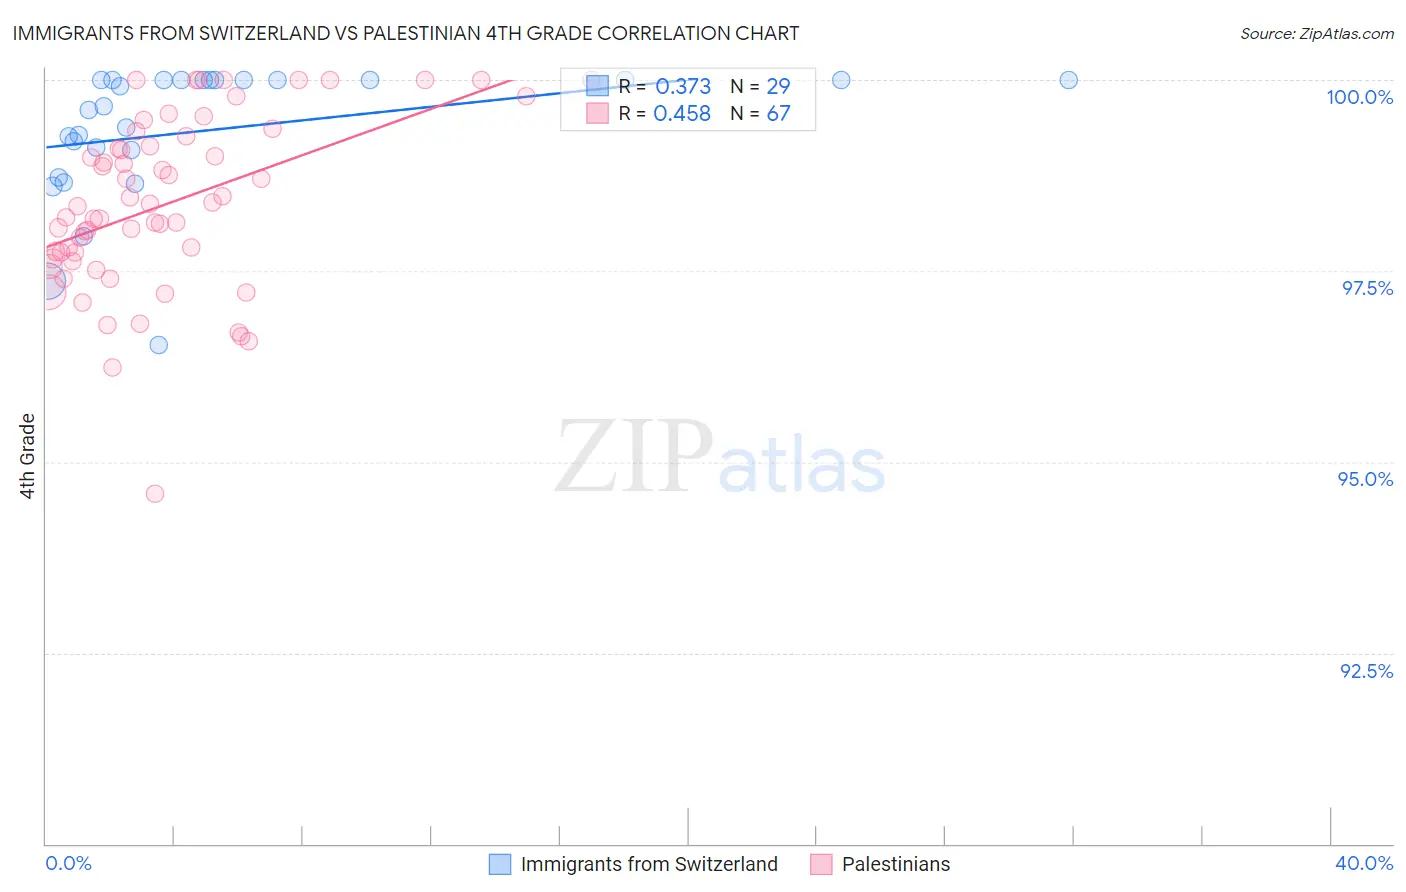
Immigrants from Switzerland vs Palestinian 4th Grade Correlation Chart
The statistical analysis conducted on geographies consisting of 148,082,451 people shows a mild positive correlation between the proportion of Immigrants from Switzerland and percentage of population with at least 4th grade education in the United States with a correlation coefficient (R) of 0.373 and weighted average of 97.8%. Similarly, the statistical analysis conducted on geographies consisting of 216,424,519 people shows a moderate positive correlation between the proportion of Palestinians and percentage of population with at least 4th grade education in the United States with a correlation coefficient (R) of 0.458 and weighted average of 97.7%, a difference of 0.11%.
4th Grade Correlation Summary
| Measurement | Immigrants from Switzerland | Palestinian |
| Minimum | 96.5% | 94.6% |
| Maximum | 100.0% | 100.0% |
| Range | 3.5% | 5.4% |
| Mean | 99.3% | 98.4% |
| Median | 99.7% | 98.3% |
| Interquartile 25% (IQ1) | 98.9% | 97.7% |
| Interquartile 75% (IQ3) | 100.0% | 99.3% |
| Interquartile Range (IQR) | 1.1% | 1.6% |
| Standard Deviation (Sample) | 0.88% | 1.1% |
| Standard Deviation (Population) | 0.87% | 1.1% |
Similar Demographics by 4th Grade
Demographics Similar to Immigrants from Switzerland by 4th Grade
In terms of 4th grade, the demographic groups most similar to Immigrants from Switzerland are Okinawan (97.8%, a difference of 0.0%), Thai (97.8%, a difference of 0.010%), Basque (97.8%, a difference of 0.010%), Immigrants from Latvia (97.8%, a difference of 0.020%), and Iroquois (97.8%, a difference of 0.020%).
| Demographics | Rating | Rank | 4th Grade |
| Immigrants | Nonimmigrants | 97.5 /100 | #104 | Exceptional 97.9% |
| German Russians | 97.5 /100 | #105 | Exceptional 97.9% |
| Immigrants | Czechoslovakia | 97.5 /100 | #106 | Exceptional 97.9% |
| Bhutanese | 97.4 /100 | #107 | Exceptional 97.9% |
| Immigrants | Singapore | 97.3 /100 | #108 | Exceptional 97.9% |
| Immigrants | Latvia | 96.8 /100 | #109 | Exceptional 97.8% |
| Thais | 96.7 /100 | #110 | Exceptional 97.8% |
| Immigrants | Switzerland | 96.1 /100 | #111 | Exceptional 97.8% |
| Okinawans | 96.0 /100 | #112 | Exceptional 97.8% |
| Basques | 95.8 /100 | #113 | Exceptional 97.8% |
| Iroquois | 95.4 /100 | #114 | Exceptional 97.8% |
| Lebanese | 95.4 /100 | #115 | Exceptional 97.8% |
| Immigrants | Croatia | 95.2 /100 | #116 | Exceptional 97.8% |
| Syrians | 94.9 /100 | #117 | Exceptional 97.8% |
| Menominee | 94.9 /100 | #118 | Exceptional 97.8% |
Demographics Similar to Palestinians by 4th Grade
In terms of 4th grade, the demographic groups most similar to Palestinians are Hmong (97.7%, a difference of 0.0%), Cambodian (97.7%, a difference of 0.0%), Immigrants from Hungary (97.7%, a difference of 0.010%), Immigrants from Romania (97.7%, a difference of 0.020%), and Immigrants from Kuwait (97.7%, a difference of 0.020%).
| Demographics | Rating | Rank | 4th Grade |
| Colville | 92.3 /100 | #127 | Exceptional 97.7% |
| Pima | 92.0 /100 | #128 | Exceptional 97.7% |
| Immigrants | Bulgaria | 91.3 /100 | #129 | Exceptional 97.7% |
| Immigrants | Romania | 90.6 /100 | #130 | Exceptional 97.7% |
| Immigrants | Kuwait | 89.7 /100 | #131 | Excellent 97.7% |
| Immigrants | Hungary | 89.3 /100 | #132 | Excellent 97.7% |
| Hmong | 88.2 /100 | #133 | Excellent 97.7% |
| Palestinians | 88.1 /100 | #134 | Excellent 97.7% |
| Cambodians | 87.8 /100 | #135 | Excellent 97.7% |
| Israelis | 86.2 /100 | #136 | Excellent 97.7% |
| Immigrants | Turkey | 86.0 /100 | #137 | Excellent 97.7% |
| Blackfeet | 86.0 /100 | #138 | Excellent 97.7% |
| Seminole | 84.7 /100 | #139 | Excellent 97.7% |
| Filipinos | 84.0 /100 | #140 | Excellent 97.7% |
| Immigrants | Greece | 83.8 /100 | #141 | Excellent 97.7% |