Okinawan vs Palestinian Householder Income Ages 25 - 44 years
COMPARE
Okinawan
Palestinian
Householder Income Ages 25 - 44 years
Householder Income Ages 25 - 44 years Comparison
Okinawans
Palestinians
$119,349
HOUSEHOLDER INCOME AGES 25 - 44 YEARS
100.0/ 100
METRIC RATING
11th/ 347
METRIC RANK
$98,777
HOUSEHOLDER INCOME AGES 25 - 44 YEARS
91.2/ 100
METRIC RATING
123rd/ 347
METRIC RANK
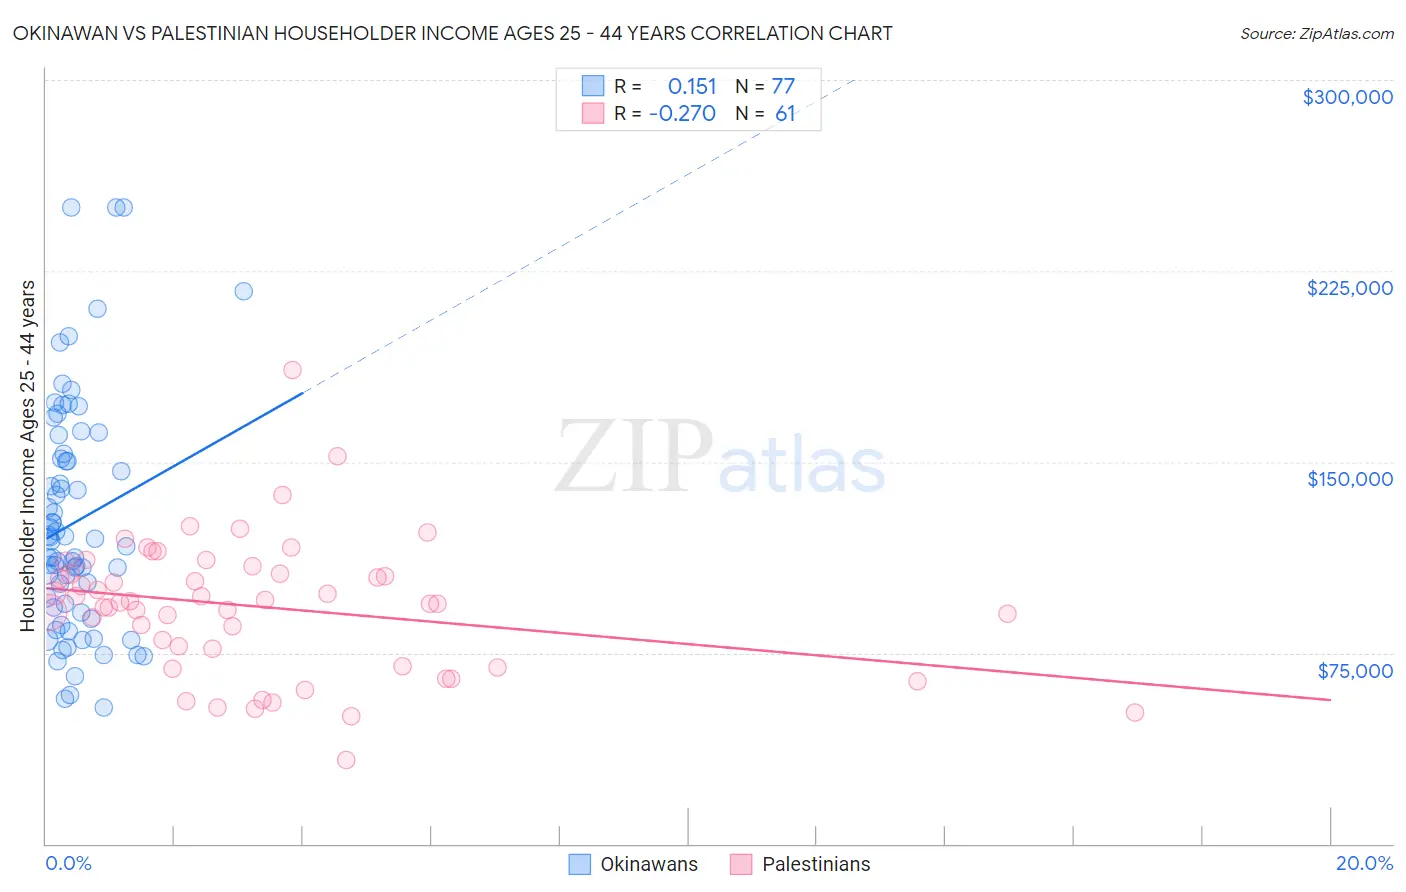
Okinawan vs Palestinian Householder Income Ages 25 - 44 years Correlation Chart
The statistical analysis conducted on geographies consisting of 73,689,702 people shows a poor positive correlation between the proportion of Okinawans and household income with householder between the ages 25 and 44 in the United States with a correlation coefficient (R) of 0.151 and weighted average of $119,349. Similarly, the statistical analysis conducted on geographies consisting of 216,290,532 people shows a weak negative correlation between the proportion of Palestinians and household income with householder between the ages 25 and 44 in the United States with a correlation coefficient (R) of -0.270 and weighted average of $98,777, a difference of 20.8%.
Householder Income Ages 25 - 44 years Correlation Summary
| Measurement | Okinawan | Palestinian |
| Minimum | $53,516 | $33,077 |
| Maximum | $250,001 | $186,111 |
| Range | $196,485 | $153,034 |
| Mean | $126,213 | $93,023 |
| Median | $118,882 | $94,675 |
| Interquartile 25% (IQ1) | $91,836 | $73,167 |
| Interquartile 75% (IQ3) | $152,291 | $107,616 |
| Interquartile Range (IQR) | $60,455 | $34,449 |
| Standard Deviation (Sample) | $45,314 | $26,611 |
| Standard Deviation (Population) | $45,019 | $26,392 |
Similar Demographics by Householder Income Ages 25 - 44 years
Demographics Similar to Okinawans by Householder Income Ages 25 - 44 years
In terms of householder income ages 25 - 44 years, the demographic groups most similar to Okinawans are Indian (Asian) ($119,496, a difference of 0.12%), Immigrants from Iran ($119,204, a difference of 0.12%), Immigrants from China ($119,756, a difference of 0.34%), Iranian ($120,292, a difference of 0.79%), and Immigrants from Ireland ($120,333, a difference of 0.82%).
| Demographics | Rating | Rank | Householder Income Ages 25 - 44 years |
| Immigrants | Singapore | 100.0 /100 | #4 | Exceptional $124,429 |
| Immigrants | India | 100.0 /100 | #5 | Exceptional $124,238 |
| Thais | 100.0 /100 | #6 | Exceptional $121,778 |
| Immigrants | Ireland | 100.0 /100 | #7 | Exceptional $120,333 |
| Iranians | 100.0 /100 | #8 | Exceptional $120,292 |
| Immigrants | China | 100.0 /100 | #9 | Exceptional $119,756 |
| Indians (Asian) | 100.0 /100 | #10 | Exceptional $119,496 |
| Okinawans | 100.0 /100 | #11 | Exceptional $119,349 |
| Immigrants | Iran | 100.0 /100 | #12 | Exceptional $119,204 |
| Immigrants | Eastern Asia | 100.0 /100 | #13 | Exceptional $118,056 |
| Immigrants | Israel | 100.0 /100 | #14 | Exceptional $117,219 |
| Immigrants | South Central Asia | 100.0 /100 | #15 | Exceptional $116,626 |
| Cypriots | 100.0 /100 | #16 | Exceptional $116,364 |
| Immigrants | Australia | 100.0 /100 | #17 | Exceptional $115,947 |
| Eastern Europeans | 100.0 /100 | #18 | Exceptional $114,523 |
Demographics Similar to Palestinians by Householder Income Ages 25 - 44 years
In terms of householder income ages 25 - 44 years, the demographic groups most similar to Palestinians are Immigrants from Uzbekistan ($98,849, a difference of 0.070%), Peruvian ($98,886, a difference of 0.11%), Zimbabwean ($98,586, a difference of 0.19%), Swedish ($99,136, a difference of 0.36%), and Pakistani ($98,401, a difference of 0.38%).
| Demographics | Rating | Rank | Householder Income Ages 25 - 44 years |
| Portuguese | 93.7 /100 | #116 | Exceptional $99,429 |
| Immigrants | Northern Africa | 93.0 /100 | #117 | Exceptional $99,232 |
| Syrians | 92.9 /100 | #118 | Exceptional $99,215 |
| Jordanians | 92.8 /100 | #119 | Exceptional $99,186 |
| Swedes | 92.7 /100 | #120 | Exceptional $99,136 |
| Peruvians | 91.7 /100 | #121 | Exceptional $98,886 |
| Immigrants | Uzbekistan | 91.5 /100 | #122 | Exceptional $98,849 |
| Palestinians | 91.2 /100 | #123 | Exceptional $98,777 |
| Zimbabweans | 90.3 /100 | #124 | Exceptional $98,586 |
| Pakistanis | 89.3 /100 | #125 | Excellent $98,401 |
| British | 89.1 /100 | #126 | Excellent $98,359 |
| Serbians | 88.9 /100 | #127 | Excellent $98,320 |
| Europeans | 88.9 /100 | #128 | Excellent $98,310 |
| Brazilians | 88.6 /100 | #129 | Excellent $98,267 |
| Immigrants | Kuwait | 87.8 /100 | #130 | Excellent $98,122 |