Immigrants from Switzerland vs Immigrants from Ireland Median Female Earnings
COMPARE
Immigrants from Switzerland
Immigrants from Ireland
Median Female Earnings
Median Female Earnings Comparison
Immigrants from Switzerland
Immigrants from Ireland
$43,996
MEDIAN FEMALE EARNINGS
100.0/ 100
METRIC RATING
37th/ 347
METRIC RANK
$47,598
MEDIAN FEMALE EARNINGS
100.0/ 100
METRIC RATING
6th/ 347
METRIC RANK
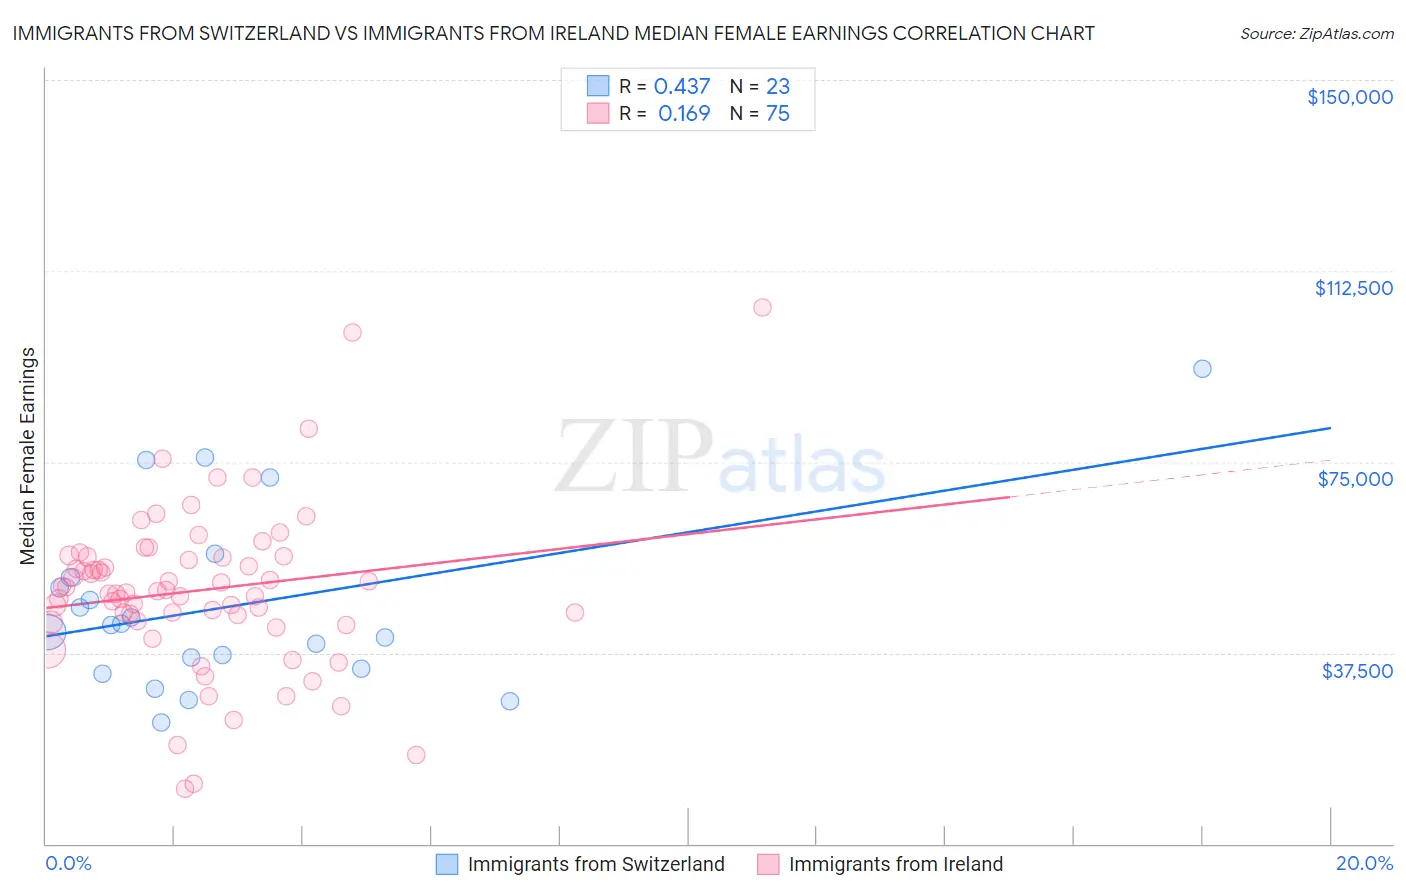
Immigrants from Switzerland vs Immigrants from Ireland Median Female Earnings Correlation Chart
The statistical analysis conducted on geographies consisting of 148,042,393 people shows a moderate positive correlation between the proportion of Immigrants from Switzerland and median female earnings in the United States with a correlation coefficient (R) of 0.437 and weighted average of $43,996. Similarly, the statistical analysis conducted on geographies consisting of 240,688,654 people shows a poor positive correlation between the proportion of Immigrants from Ireland and median female earnings in the United States with a correlation coefficient (R) of 0.169 and weighted average of $47,598, a difference of 8.2%.
Median Female Earnings Correlation Summary
| Measurement | Immigrants from Switzerland | Immigrants from Ireland |
| Minimum | $23,823 | $10,833 |
| Maximum | $93,289 | $105,254 |
| Range | $69,466 | $94,421 |
| Mean | $46,683 | $49,745 |
| Median | $43,003 | $49,556 |
| Interquartile 25% (IQ1) | $34,297 | $43,791 |
| Interquartile 75% (IQ3) | $52,304 | $56,354 |
| Interquartile Range (IQR) | $18,007 | $12,564 |
| Standard Deviation (Sample) | $17,546 | $15,960 |
| Standard Deviation (Population) | $17,160 | $15,854 |
Similar Demographics by Median Female Earnings
Demographics Similar to Immigrants from Switzerland by Median Female Earnings
In terms of median female earnings, the demographic groups most similar to Immigrants from Switzerland are Latvian ($43,941, a difference of 0.12%), Immigrants from Turkey ($44,066, a difference of 0.16%), Israeli ($43,852, a difference of 0.33%), Immigrants from Sri Lanka ($44,161, a difference of 0.37%), and Immigrants from Malaysia ($43,835, a difference of 0.37%).
| Demographics | Rating | Rank | Median Female Earnings |
| Asians | 100.0 /100 | #30 | Exceptional $44,586 |
| Immigrants | France | 100.0 /100 | #31 | Exceptional $44,541 |
| Immigrants | Northern Europe | 100.0 /100 | #32 | Exceptional $44,366 |
| Immigrants | Asia | 100.0 /100 | #33 | Exceptional $44,198 |
| Russians | 100.0 /100 | #34 | Exceptional $44,169 |
| Immigrants | Sri Lanka | 100.0 /100 | #35 | Exceptional $44,161 |
| Immigrants | Turkey | 100.0 /100 | #36 | Exceptional $44,066 |
| Immigrants | Switzerland | 100.0 /100 | #37 | Exceptional $43,996 |
| Latvians | 100.0 /100 | #38 | Exceptional $43,941 |
| Israelis | 100.0 /100 | #39 | Exceptional $43,852 |
| Immigrants | Malaysia | 100.0 /100 | #40 | Exceptional $43,835 |
| Bhutanese | 100.0 /100 | #41 | Exceptional $43,648 |
| Immigrants | Denmark | 100.0 /100 | #42 | Exceptional $43,646 |
| Bulgarians | 100.0 /100 | #43 | Exceptional $43,638 |
| Immigrants | Czechoslovakia | 100.0 /100 | #44 | Exceptional $43,571 |
Demographics Similar to Immigrants from Ireland by Median Female Earnings
In terms of median female earnings, the demographic groups most similar to Immigrants from Ireland are Thai ($47,577, a difference of 0.040%), Iranian ($47,421, a difference of 0.37%), Immigrants from Singapore ($47,986, a difference of 0.82%), Immigrants from Iran ($47,154, a difference of 0.94%), and Immigrants from China ($46,972, a difference of 1.3%).
| Demographics | Rating | Rank | Median Female Earnings |
| Immigrants | Hong Kong | 100.0 /100 | #1 | Exceptional $49,818 |
| Filipinos | 100.0 /100 | #2 | Exceptional $49,508 |
| Immigrants | Taiwan | 100.0 /100 | #3 | Exceptional $49,256 |
| Immigrants | India | 100.0 /100 | #4 | Exceptional $48,292 |
| Immigrants | Singapore | 100.0 /100 | #5 | Exceptional $47,986 |
| Immigrants | Ireland | 100.0 /100 | #6 | Exceptional $47,598 |
| Thais | 100.0 /100 | #7 | Exceptional $47,577 |
| Iranians | 100.0 /100 | #8 | Exceptional $47,421 |
| Immigrants | Iran | 100.0 /100 | #9 | Exceptional $47,154 |
| Immigrants | China | 100.0 /100 | #10 | Exceptional $46,972 |
| Okinawans | 100.0 /100 | #11 | Exceptional $46,905 |
| Immigrants | Israel | 100.0 /100 | #12 | Exceptional $46,902 |
| Immigrants | Australia | 100.0 /100 | #13 | Exceptional $46,573 |
| Soviet Union | 100.0 /100 | #14 | Exceptional $46,556 |
| Immigrants | Eastern Asia | 100.0 /100 | #15 | Exceptional $46,502 |