Immigrants from Switzerland vs Japanese Median Female Earnings
COMPARE
Immigrants from Switzerland
Japanese
Median Female Earnings
Median Female Earnings Comparison
Immigrants from Switzerland
Japanese
$43,996
MEDIAN FEMALE EARNINGS
100.0/ 100
METRIC RATING
37th/ 347
METRIC RANK
$38,528
MEDIAN FEMALE EARNINGS
8.1/ 100
METRIC RATING
222nd/ 347
METRIC RANK
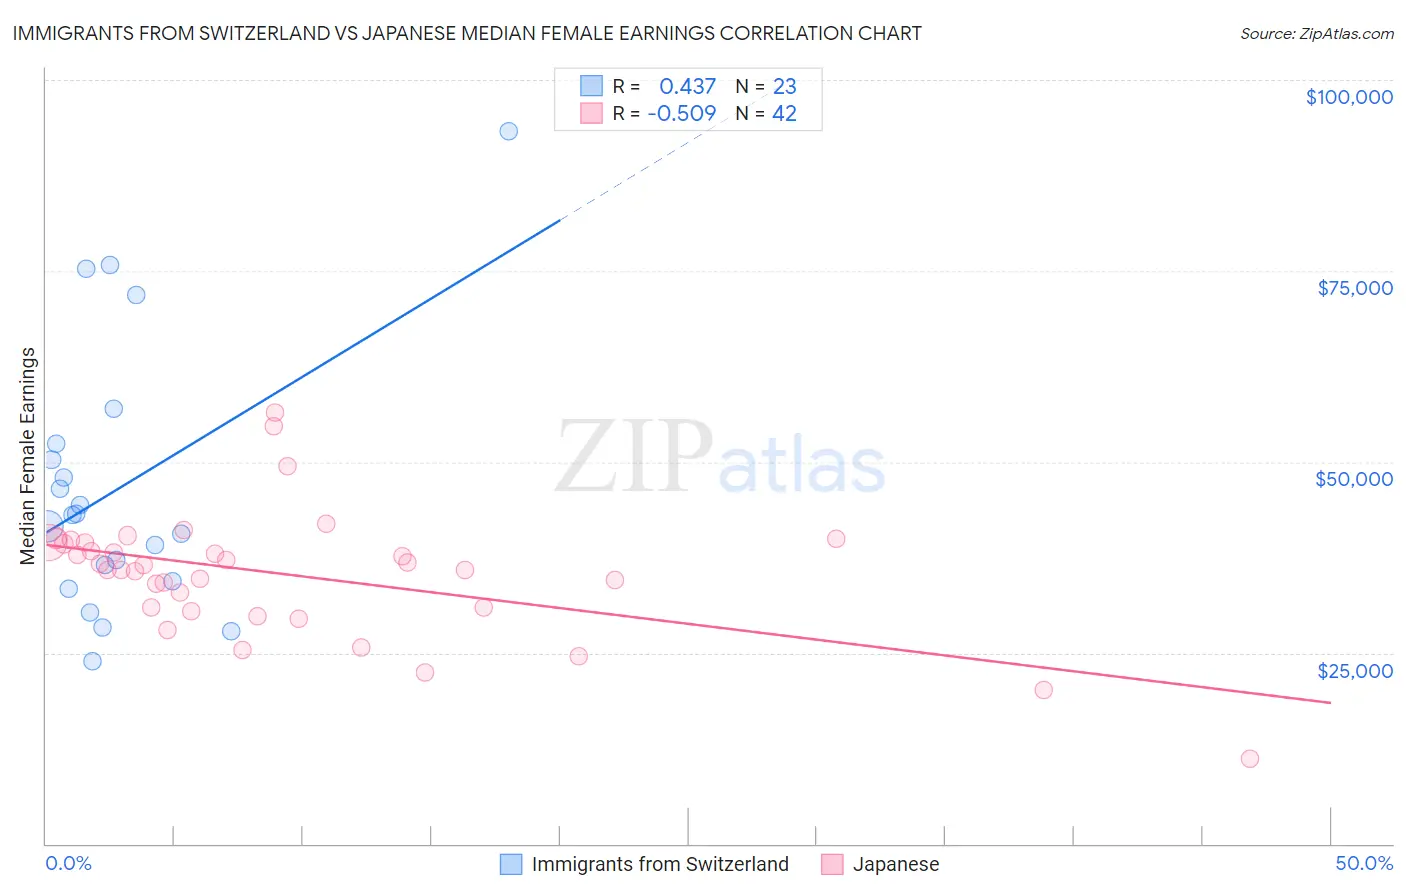
Immigrants from Switzerland vs Japanese Median Female Earnings Correlation Chart
The statistical analysis conducted on geographies consisting of 148,042,393 people shows a moderate positive correlation between the proportion of Immigrants from Switzerland and median female earnings in the United States with a correlation coefficient (R) of 0.437 and weighted average of $43,996. Similarly, the statistical analysis conducted on geographies consisting of 249,158,779 people shows a substantial negative correlation between the proportion of Japanese and median female earnings in the United States with a correlation coefficient (R) of -0.509 and weighted average of $38,528, a difference of 14.2%.
Median Female Earnings Correlation Summary
| Measurement | Immigrants from Switzerland | Japanese |
| Minimum | $23,823 | $11,066 |
| Maximum | $93,289 | $56,543 |
| Range | $69,466 | $45,477 |
| Mean | $46,683 | $35,269 |
| Median | $43,003 | $36,190 |
| Interquartile 25% (IQ1) | $34,297 | $30,918 |
| Interquartile 75% (IQ3) | $52,304 | $39,451 |
| Interquartile Range (IQR) | $18,007 | $8,533 |
| Standard Deviation (Sample) | $17,546 | $8,213 |
| Standard Deviation (Population) | $17,160 | $8,115 |
Similar Demographics by Median Female Earnings
Demographics Similar to Immigrants from Switzerland by Median Female Earnings
In terms of median female earnings, the demographic groups most similar to Immigrants from Switzerland are Latvian ($43,941, a difference of 0.12%), Immigrants from Turkey ($44,066, a difference of 0.16%), Israeli ($43,852, a difference of 0.33%), Immigrants from Sri Lanka ($44,161, a difference of 0.37%), and Immigrants from Malaysia ($43,835, a difference of 0.37%).
| Demographics | Rating | Rank | Median Female Earnings |
| Asians | 100.0 /100 | #30 | Exceptional $44,586 |
| Immigrants | France | 100.0 /100 | #31 | Exceptional $44,541 |
| Immigrants | Northern Europe | 100.0 /100 | #32 | Exceptional $44,366 |
| Immigrants | Asia | 100.0 /100 | #33 | Exceptional $44,198 |
| Russians | 100.0 /100 | #34 | Exceptional $44,169 |
| Immigrants | Sri Lanka | 100.0 /100 | #35 | Exceptional $44,161 |
| Immigrants | Turkey | 100.0 /100 | #36 | Exceptional $44,066 |
| Immigrants | Switzerland | 100.0 /100 | #37 | Exceptional $43,996 |
| Latvians | 100.0 /100 | #38 | Exceptional $43,941 |
| Israelis | 100.0 /100 | #39 | Exceptional $43,852 |
| Immigrants | Malaysia | 100.0 /100 | #40 | Exceptional $43,835 |
| Bhutanese | 100.0 /100 | #41 | Exceptional $43,648 |
| Immigrants | Denmark | 100.0 /100 | #42 | Exceptional $43,646 |
| Bulgarians | 100.0 /100 | #43 | Exceptional $43,638 |
| Immigrants | Czechoslovakia | 100.0 /100 | #44 | Exceptional $43,571 |
Demographics Similar to Japanese by Median Female Earnings
In terms of median female earnings, the demographic groups most similar to Japanese are Immigrants from Sudan ($38,511, a difference of 0.040%), Yugoslavian ($38,573, a difference of 0.12%), Immigrants from the Azores ($38,573, a difference of 0.12%), Native Hawaiian ($38,461, a difference of 0.17%), and Nepalese ($38,603, a difference of 0.19%).
| Demographics | Rating | Rank | Median Female Earnings |
| Spaniards | 10.3 /100 | #215 | Poor $38,656 |
| Immigrants | Ecuador | 10.1 /100 | #216 | Poor $38,644 |
| Immigrants | Jamaica | 9.7 /100 | #217 | Tragic $38,625 |
| Cape Verdeans | 9.5 /100 | #218 | Tragic $38,614 |
| Nepalese | 9.3 /100 | #219 | Tragic $38,603 |
| Yugoslavians | 8.8 /100 | #220 | Tragic $38,573 |
| Immigrants | Azores | 8.8 /100 | #221 | Tragic $38,573 |
| Japanese | 8.1 /100 | #222 | Tragic $38,528 |
| Immigrants | Sudan | 7.8 /100 | #223 | Tragic $38,511 |
| Native Hawaiians | 7.1 /100 | #224 | Tragic $38,461 |
| French | 7.0 /100 | #225 | Tragic $38,457 |
| French Canadians | 6.8 /100 | #226 | Tragic $38,436 |
| Scottish | 6.3 /100 | #227 | Tragic $38,397 |
| Sub-Saharan Africans | 6.2 /100 | #228 | Tragic $38,391 |
| Belgians | 6.1 /100 | #229 | Tragic $38,382 |