Immigrants from Sudan vs Ottawa Householder Income Ages 25 - 44 years
COMPARE
Immigrants from Sudan
Ottawa
Householder Income Ages 25 - 44 years
Householder Income Ages 25 - 44 years Comparison
Immigrants from Sudan
Ottawa
$86,109
HOUSEHOLDER INCOME AGES 25 - 44 YEARS
0.9/ 100
METRIC RATING
248th/ 347
METRIC RANK
$79,012
HOUSEHOLDER INCOME AGES 25 - 44 YEARS
0.0/ 100
METRIC RATING
315th/ 347
METRIC RANK
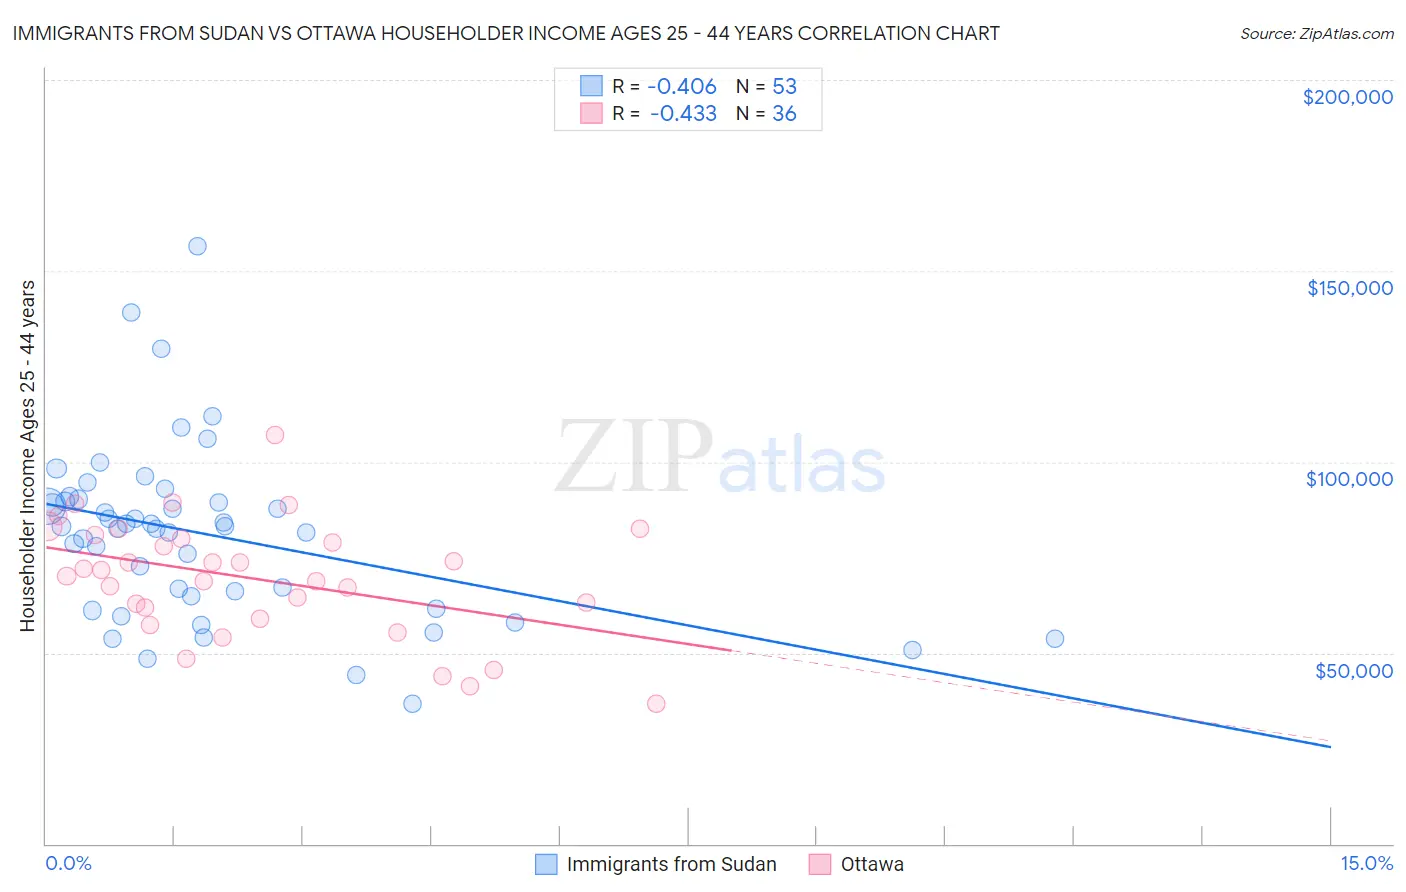
Immigrants from Sudan vs Ottawa Householder Income Ages 25 - 44 years Correlation Chart
The statistical analysis conducted on geographies consisting of 118,898,989 people shows a moderate negative correlation between the proportion of Immigrants from Sudan and household income with householder between the ages 25 and 44 in the United States with a correlation coefficient (R) of -0.406 and weighted average of $86,109. Similarly, the statistical analysis conducted on geographies consisting of 49,887,469 people shows a moderate negative correlation between the proportion of Ottawa and household income with householder between the ages 25 and 44 in the United States with a correlation coefficient (R) of -0.433 and weighted average of $79,012, a difference of 9.0%.
Householder Income Ages 25 - 44 years Correlation Summary
| Measurement | Immigrants from Sudan | Ottawa |
| Minimum | $36,667 | $36,563 |
| Maximum | $156,518 | $106,935 |
| Range | $119,851 | $70,372 |
| Mean | $80,997 | $69,424 |
| Median | $83,128 | $70,740 |
| Interquartile 25% (IQ1) | $63,223 | $60,457 |
| Interquartile 75% (IQ3) | $89,871 | $80,364 |
| Interquartile Range (IQR) | $26,648 | $19,907 |
| Standard Deviation (Sample) | $22,850 | $15,349 |
| Standard Deviation (Population) | $22,634 | $15,134 |
Similar Demographics by Householder Income Ages 25 - 44 years
Demographics Similar to Immigrants from Sudan by Householder Income Ages 25 - 44 years
In terms of householder income ages 25 - 44 years, the demographic groups most similar to Immigrants from Sudan are French American Indian ($85,899, a difference of 0.24%), Pennsylvania German ($85,836, a difference of 0.32%), Cape Verdean ($85,758, a difference of 0.41%), Immigrants from Western Africa ($85,676, a difference of 0.51%), and Immigrants from Nigeria ($86,589, a difference of 0.56%).
| Demographics | Rating | Rank | Householder Income Ages 25 - 44 years |
| Nigerians | 2.2 /100 | #241 | Tragic $87,730 |
| West Indians | 1.7 /100 | #242 | Tragic $87,205 |
| Immigrants | West Indies | 1.5 /100 | #243 | Tragic $87,063 |
| Immigrants | Venezuela | 1.5 /100 | #244 | Tragic $87,038 |
| Immigrants | El Salvador | 1.4 /100 | #245 | Tragic $86,913 |
| Immigrants | Burma/Myanmar | 1.3 /100 | #246 | Tragic $86,736 |
| Immigrants | Nigeria | 1.2 /100 | #247 | Tragic $86,589 |
| Immigrants | Sudan | 0.9 /100 | #248 | Tragic $86,109 |
| French American Indians | 0.8 /100 | #249 | Tragic $85,899 |
| Pennsylvania Germans | 0.8 /100 | #250 | Tragic $85,836 |
| Cape Verdeans | 0.8 /100 | #251 | Tragic $85,758 |
| Immigrants | Western Africa | 0.7 /100 | #252 | Tragic $85,676 |
| British West Indians | 0.7 /100 | #253 | Tragic $85,565 |
| Immigrants | Laos | 0.7 /100 | #254 | Tragic $85,553 |
| German Russians | 0.6 /100 | #255 | Tragic $85,220 |
Demographics Similar to Ottawa by Householder Income Ages 25 - 44 years
In terms of householder income ages 25 - 44 years, the demographic groups most similar to Ottawa are African ($78,986, a difference of 0.030%), U.S. Virgin Islander ($78,911, a difference of 0.13%), Cheyenne ($79,152, a difference of 0.18%), Immigrants from Mexico ($78,809, a difference of 0.26%), and Menominee ($79,358, a difference of 0.44%).
| Demographics | Rating | Rank | Householder Income Ages 25 - 44 years |
| Immigrants | Central America | 0.0 /100 | #308 | Tragic $80,012 |
| Chippewa | 0.0 /100 | #309 | Tragic $80,005 |
| Fijians | 0.0 /100 | #310 | Tragic $79,956 |
| Indonesians | 0.0 /100 | #311 | Tragic $79,543 |
| Immigrants | Haiti | 0.0 /100 | #312 | Tragic $79,391 |
| Menominee | 0.0 /100 | #313 | Tragic $79,358 |
| Cheyenne | 0.0 /100 | #314 | Tragic $79,152 |
| Ottawa | 0.0 /100 | #315 | Tragic $79,012 |
| Africans | 0.0 /100 | #316 | Tragic $78,986 |
| U.S. Virgin Islanders | 0.0 /100 | #317 | Tragic $78,911 |
| Immigrants | Mexico | 0.0 /100 | #318 | Tragic $78,809 |
| Hondurans | 0.0 /100 | #319 | Tragic $78,540 |
| Choctaw | 0.0 /100 | #320 | Tragic $78,168 |
| Immigrants | Zaire | 0.0 /100 | #321 | Tragic $78,045 |
| Chickasaw | 0.0 /100 | #322 | Tragic $77,929 |