Immigrants from Sudan vs German Russian Householder Income Ages 25 - 44 years
COMPARE
Immigrants from Sudan
German Russian
Householder Income Ages 25 - 44 years
Householder Income Ages 25 - 44 years Comparison
Immigrants from Sudan
German Russians
$86,109
HOUSEHOLDER INCOME AGES 25 - 44 YEARS
0.9/ 100
METRIC RATING
248th/ 347
METRIC RANK
$85,220
HOUSEHOLDER INCOME AGES 25 - 44 YEARS
0.6/ 100
METRIC RATING
255th/ 347
METRIC RANK
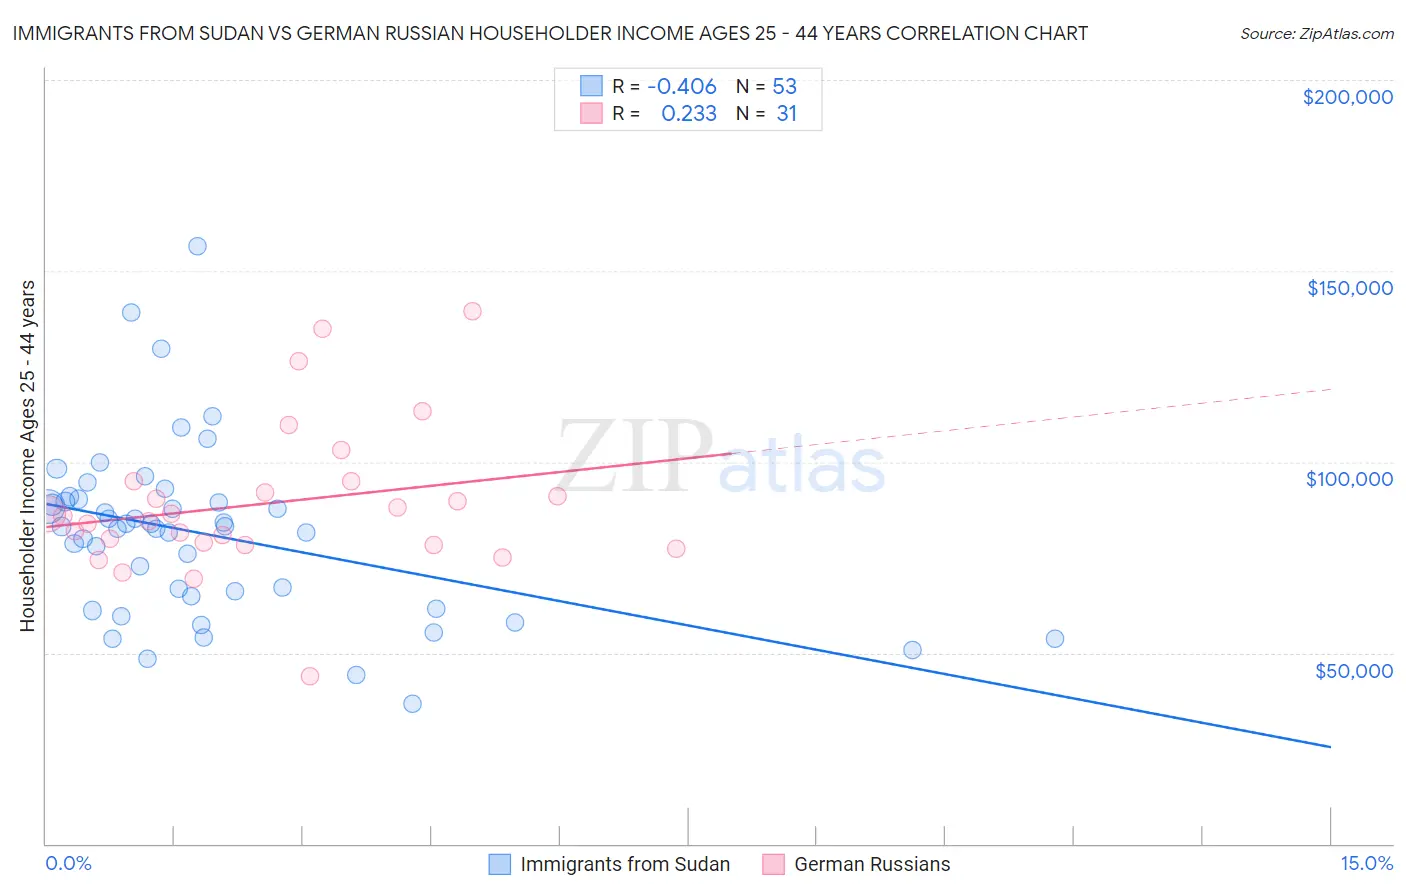
Immigrants from Sudan vs German Russian Householder Income Ages 25 - 44 years Correlation Chart
The statistical analysis conducted on geographies consisting of 118,898,989 people shows a moderate negative correlation between the proportion of Immigrants from Sudan and household income with householder between the ages 25 and 44 in the United States with a correlation coefficient (R) of -0.406 and weighted average of $86,109. Similarly, the statistical analysis conducted on geographies consisting of 96,370,550 people shows a weak positive correlation between the proportion of German Russians and household income with householder between the ages 25 and 44 in the United States with a correlation coefficient (R) of 0.233 and weighted average of $85,220, a difference of 1.0%.
Householder Income Ages 25 - 44 years Correlation Summary
| Measurement | Immigrants from Sudan | German Russian |
| Minimum | $36,667 | $43,750 |
| Maximum | $156,518 | $139,479 |
| Range | $119,851 | $95,729 |
| Mean | $80,997 | $89,217 |
| Median | $83,128 | $85,878 |
| Interquartile 25% (IQ1) | $63,223 | $78,393 |
| Interquartile 75% (IQ3) | $89,871 | $94,895 |
| Interquartile Range (IQR) | $26,648 | $16,502 |
| Standard Deviation (Sample) | $22,850 | $19,398 |
| Standard Deviation (Population) | $22,634 | $19,082 |
Demographics Similar to Immigrants from Sudan and German Russians by Householder Income Ages 25 - 44 years
In terms of householder income ages 25 - 44 years, the demographic groups most similar to Immigrants from Sudan are French American Indian ($85,899, a difference of 0.24%), Pennsylvania German ($85,836, a difference of 0.32%), Cape Verdean ($85,758, a difference of 0.41%), Immigrants from Western Africa ($85,676, a difference of 0.51%), and Immigrants from Nigeria ($86,589, a difference of 0.56%). Similarly, the demographic groups most similar to German Russians are Central American ($85,144, a difference of 0.090%), Mexican American Indian ($85,066, a difference of 0.18%), Immigrants from Nicaragua ($84,914, a difference of 0.36%), Immigrants from Laos ($85,553, a difference of 0.39%), and British West Indian ($85,565, a difference of 0.40%).
| Demographics | Rating | Rank | Householder Income Ages 25 - 44 years |
| Nigerians | 2.2 /100 | #241 | Tragic $87,730 |
| West Indians | 1.7 /100 | #242 | Tragic $87,205 |
| Immigrants | West Indies | 1.5 /100 | #243 | Tragic $87,063 |
| Immigrants | Venezuela | 1.5 /100 | #244 | Tragic $87,038 |
| Immigrants | El Salvador | 1.4 /100 | #245 | Tragic $86,913 |
| Immigrants | Burma/Myanmar | 1.3 /100 | #246 | Tragic $86,736 |
| Immigrants | Nigeria | 1.2 /100 | #247 | Tragic $86,589 |
| Immigrants | Sudan | 0.9 /100 | #248 | Tragic $86,109 |
| French American Indians | 0.8 /100 | #249 | Tragic $85,899 |
| Pennsylvania Germans | 0.8 /100 | #250 | Tragic $85,836 |
| Cape Verdeans | 0.8 /100 | #251 | Tragic $85,758 |
| Immigrants | Western Africa | 0.7 /100 | #252 | Tragic $85,676 |
| British West Indians | 0.7 /100 | #253 | Tragic $85,565 |
| Immigrants | Laos | 0.7 /100 | #254 | Tragic $85,553 |
| German Russians | 0.6 /100 | #255 | Tragic $85,220 |
| Central Americans | 0.5 /100 | #256 | Tragic $85,144 |
| Mexican American Indians | 0.5 /100 | #257 | Tragic $85,066 |
| Immigrants | Nicaragua | 0.5 /100 | #258 | Tragic $84,914 |
| Immigrants | Senegal | 0.5 /100 | #259 | Tragic $84,848 |
| Americans | 0.4 /100 | #260 | Tragic $84,791 |
| Inupiat | 0.4 /100 | #261 | Tragic $84,619 |