Immigrants from Sudan vs Panamanian Householder Income Ages 25 - 44 years
COMPARE
Immigrants from Sudan
Panamanian
Householder Income Ages 25 - 44 years
Householder Income Ages 25 - 44 years Comparison
Immigrants from Sudan
Panamanians
$86,109
HOUSEHOLDER INCOME AGES 25 - 44 YEARS
0.9/ 100
METRIC RATING
248th/ 347
METRIC RANK
$90,193
HOUSEHOLDER INCOME AGES 25 - 44 YEARS
8.1/ 100
METRIC RATING
215th/ 347
METRIC RANK
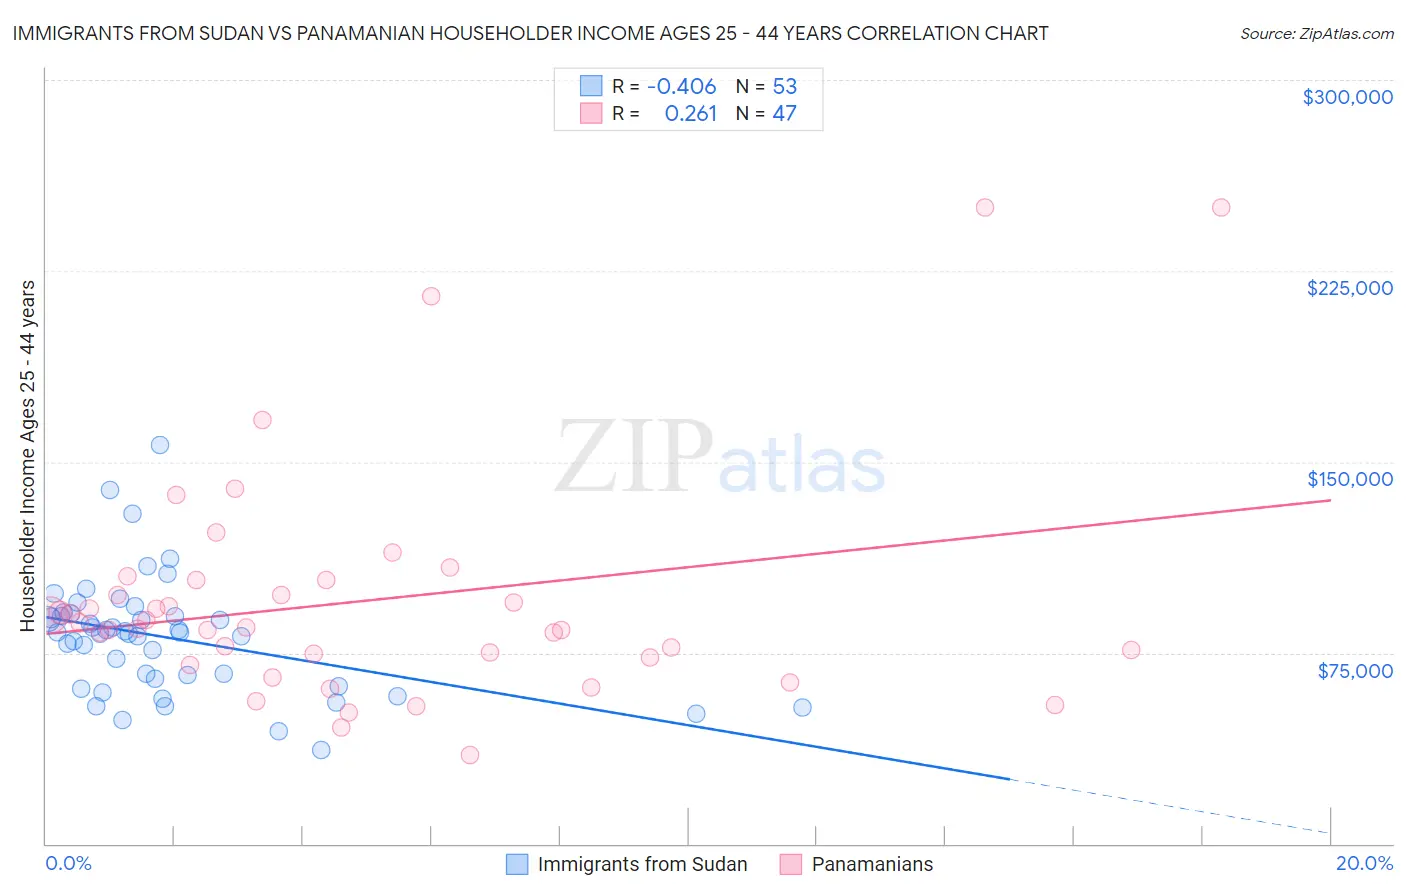
Immigrants from Sudan vs Panamanian Householder Income Ages 25 - 44 years Correlation Chart
The statistical analysis conducted on geographies consisting of 118,898,989 people shows a moderate negative correlation between the proportion of Immigrants from Sudan and household income with householder between the ages 25 and 44 in the United States with a correlation coefficient (R) of -0.406 and weighted average of $86,109. Similarly, the statistical analysis conducted on geographies consisting of 280,855,443 people shows a weak positive correlation between the proportion of Panamanians and household income with householder between the ages 25 and 44 in the United States with a correlation coefficient (R) of 0.261 and weighted average of $90,193, a difference of 4.7%.
Householder Income Ages 25 - 44 years Correlation Summary
| Measurement | Immigrants from Sudan | Panamanian |
| Minimum | $36,667 | $34,890 |
| Maximum | $156,518 | $250,001 |
| Range | $119,851 | $215,111 |
| Mean | $80,997 | $95,499 |
| Median | $83,128 | $85,019 |
| Interquartile 25% (IQ1) | $63,223 | $72,969 |
| Interquartile 75% (IQ3) | $89,871 | $103,669 |
| Interquartile Range (IQR) | $26,648 | $30,700 |
| Standard Deviation (Sample) | $22,850 | $45,169 |
| Standard Deviation (Population) | $22,634 | $44,686 |
Similar Demographics by Householder Income Ages 25 - 44 years
Demographics Similar to Immigrants from Sudan by Householder Income Ages 25 - 44 years
In terms of householder income ages 25 - 44 years, the demographic groups most similar to Immigrants from Sudan are French American Indian ($85,899, a difference of 0.24%), Pennsylvania German ($85,836, a difference of 0.32%), Cape Verdean ($85,758, a difference of 0.41%), Immigrants from Western Africa ($85,676, a difference of 0.51%), and Immigrants from Nigeria ($86,589, a difference of 0.56%).
| Demographics | Rating | Rank | Householder Income Ages 25 - 44 years |
| Nigerians | 2.2 /100 | #241 | Tragic $87,730 |
| West Indians | 1.7 /100 | #242 | Tragic $87,205 |
| Immigrants | West Indies | 1.5 /100 | #243 | Tragic $87,063 |
| Immigrants | Venezuela | 1.5 /100 | #244 | Tragic $87,038 |
| Immigrants | El Salvador | 1.4 /100 | #245 | Tragic $86,913 |
| Immigrants | Burma/Myanmar | 1.3 /100 | #246 | Tragic $86,736 |
| Immigrants | Nigeria | 1.2 /100 | #247 | Tragic $86,589 |
| Immigrants | Sudan | 0.9 /100 | #248 | Tragic $86,109 |
| French American Indians | 0.8 /100 | #249 | Tragic $85,899 |
| Pennsylvania Germans | 0.8 /100 | #250 | Tragic $85,836 |
| Cape Verdeans | 0.8 /100 | #251 | Tragic $85,758 |
| Immigrants | Western Africa | 0.7 /100 | #252 | Tragic $85,676 |
| British West Indians | 0.7 /100 | #253 | Tragic $85,565 |
| Immigrants | Laos | 0.7 /100 | #254 | Tragic $85,553 |
| German Russians | 0.6 /100 | #255 | Tragic $85,220 |
Demographics Similar to Panamanians by Householder Income Ages 25 - 44 years
In terms of householder income ages 25 - 44 years, the demographic groups most similar to Panamanians are Ghanaian ($90,137, a difference of 0.060%), Immigrants from Africa ($90,372, a difference of 0.20%), Scotch-Irish ($89,969, a difference of 0.25%), Immigrants from Bangladesh ($90,448, a difference of 0.28%), and Guyanese ($89,940, a difference of 0.28%).
| Demographics | Rating | Rank | Householder Income Ages 25 - 44 years |
| Immigrants | Thailand | 14.3 /100 | #208 | Poor $91,337 |
| Immigrants | Uruguay | 13.2 /100 | #209 | Poor $91,171 |
| Immigrants | Kenya | 10.9 /100 | #210 | Poor $90,767 |
| Iraqis | 10.8 /100 | #211 | Poor $90,764 |
| Hawaiians | 10.6 /100 | #212 | Poor $90,722 |
| Immigrants | Bangladesh | 9.3 /100 | #213 | Tragic $90,448 |
| Immigrants | Africa | 8.9 /100 | #214 | Tragic $90,372 |
| Panamanians | 8.1 /100 | #215 | Tragic $90,193 |
| Ghanaians | 7.9 /100 | #216 | Tragic $90,137 |
| Scotch-Irish | 7.3 /100 | #217 | Tragic $89,969 |
| Guyanese | 7.1 /100 | #218 | Tragic $89,940 |
| Delaware | 6.9 /100 | #219 | Tragic $89,876 |
| Trinidadians and Tobagonians | 6.8 /100 | #220 | Tragic $89,856 |
| Immigrants | Trinidad and Tobago | 6.5 /100 | #221 | Tragic $89,748 |
| Immigrants | Ecuador | 6.2 /100 | #222 | Tragic $89,673 |