Immigrants from Northern Europe vs Ottawa Householder Income Ages 25 - 44 years
COMPARE
Immigrants from Northern Europe
Ottawa
Householder Income Ages 25 - 44 years
Householder Income Ages 25 - 44 years Comparison
Immigrants from Northern Europe
Ottawa
$111,676
HOUSEHOLDER INCOME AGES 25 - 44 YEARS
100.0/ 100
METRIC RATING
25th/ 347
METRIC RANK
$79,012
HOUSEHOLDER INCOME AGES 25 - 44 YEARS
0.0/ 100
METRIC RATING
315th/ 347
METRIC RANK
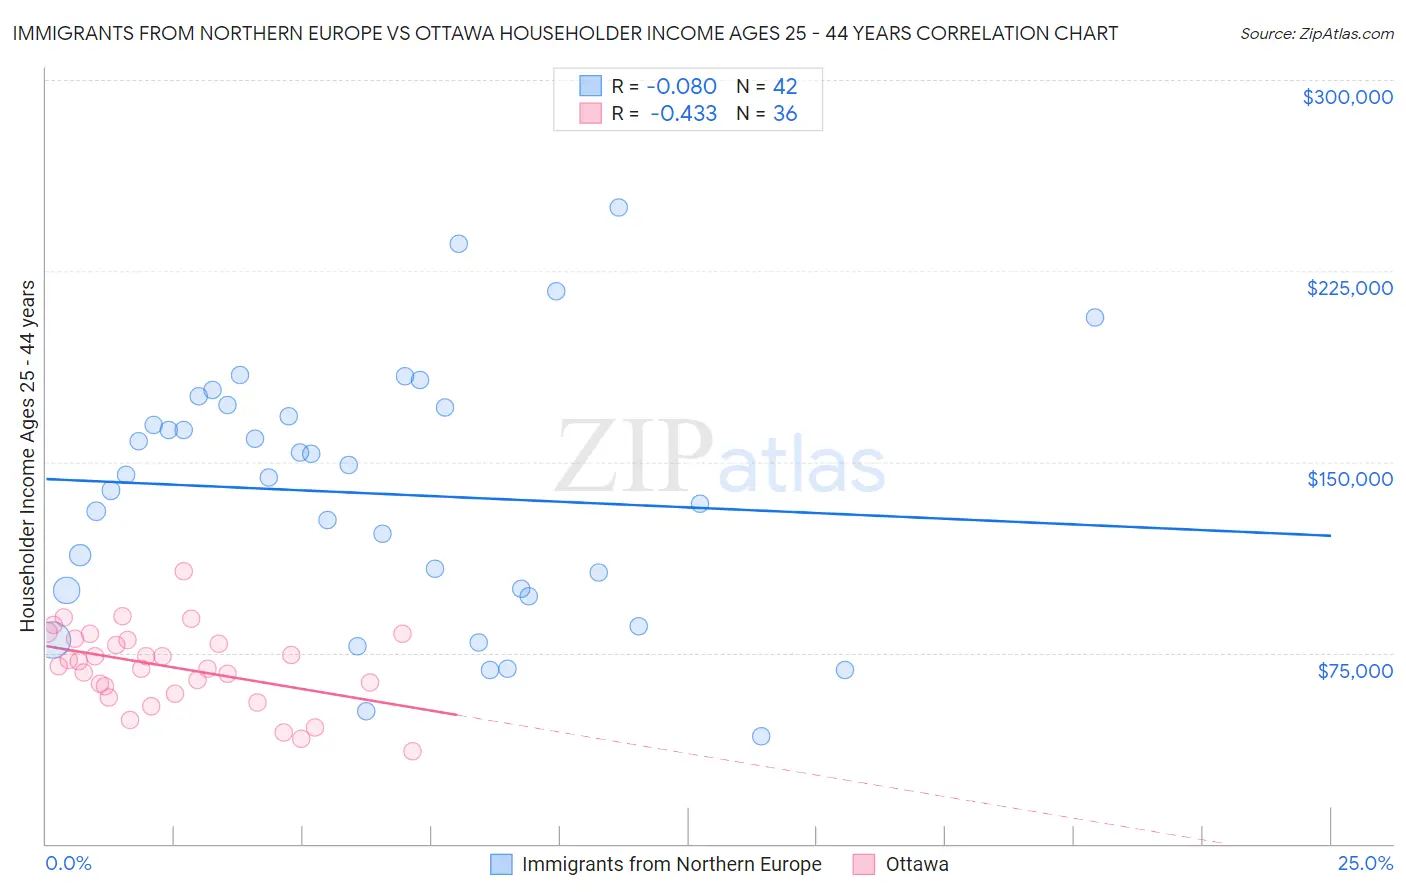
Immigrants from Northern Europe vs Ottawa Householder Income Ages 25 - 44 years Correlation Chart
The statistical analysis conducted on geographies consisting of 475,162,108 people shows a slight negative correlation between the proportion of Immigrants from Northern Europe and household income with householder between the ages 25 and 44 in the United States with a correlation coefficient (R) of -0.080 and weighted average of $111,676. Similarly, the statistical analysis conducted on geographies consisting of 49,887,469 people shows a moderate negative correlation between the proportion of Ottawa and household income with householder between the ages 25 and 44 in the United States with a correlation coefficient (R) of -0.433 and weighted average of $79,012, a difference of 41.3%.
Householder Income Ages 25 - 44 years Correlation Summary
| Measurement | Immigrants from Northern Europe | Ottawa |
| Minimum | $42,036 | $36,563 |
| Maximum | $250,001 | $106,935 |
| Range | $207,965 | $70,372 |
| Mean | $137,540 | $69,424 |
| Median | $144,261 | $70,740 |
| Interquartile 25% (IQ1) | $99,498 | $60,457 |
| Interquartile 75% (IQ3) | $171,539 | $80,364 |
| Interquartile Range (IQR) | $72,041 | $19,907 |
| Standard Deviation (Sample) | $49,597 | $15,349 |
| Standard Deviation (Population) | $49,003 | $15,134 |
Similar Demographics by Householder Income Ages 25 - 44 years
Demographics Similar to Immigrants from Northern Europe by Householder Income Ages 25 - 44 years
In terms of householder income ages 25 - 44 years, the demographic groups most similar to Immigrants from Northern Europe are Immigrants from Sweden ($112,010, a difference of 0.30%), Immigrants from Japan ($112,228, a difference of 0.49%), Immigrants from Belgium ($112,575, a difference of 0.80%), Immigrants from Asia ($110,787, a difference of 0.80%), and Asian ($112,666, a difference of 0.89%).
| Demographics | Rating | Rank | Householder Income Ages 25 - 44 years |
| Eastern Europeans | 100.0 /100 | #18 | Exceptional $114,523 |
| Burmese | 100.0 /100 | #19 | Exceptional $113,701 |
| Immigrants | Korea | 100.0 /100 | #20 | Exceptional $113,401 |
| Asians | 100.0 /100 | #21 | Exceptional $112,666 |
| Immigrants | Belgium | 100.0 /100 | #22 | Exceptional $112,575 |
| Immigrants | Japan | 100.0 /100 | #23 | Exceptional $112,228 |
| Immigrants | Sweden | 100.0 /100 | #24 | Exceptional $112,010 |
| Immigrants | Northern Europe | 100.0 /100 | #25 | Exceptional $111,676 |
| Immigrants | Asia | 100.0 /100 | #26 | Exceptional $110,787 |
| Russians | 100.0 /100 | #27 | Exceptional $110,398 |
| Immigrants | Denmark | 100.0 /100 | #28 | Exceptional $110,363 |
| Turks | 100.0 /100 | #29 | Exceptional $110,318 |
| Immigrants | Greece | 100.0 /100 | #30 | Exceptional $110,103 |
| Maltese | 100.0 /100 | #31 | Exceptional $110,064 |
| Immigrants | Sri Lanka | 100.0 /100 | #32 | Exceptional $109,741 |
Demographics Similar to Ottawa by Householder Income Ages 25 - 44 years
In terms of householder income ages 25 - 44 years, the demographic groups most similar to Ottawa are African ($78,986, a difference of 0.030%), U.S. Virgin Islander ($78,911, a difference of 0.13%), Cheyenne ($79,152, a difference of 0.18%), Immigrants from Mexico ($78,809, a difference of 0.26%), and Menominee ($79,358, a difference of 0.44%).
| Demographics | Rating | Rank | Householder Income Ages 25 - 44 years |
| Immigrants | Central America | 0.0 /100 | #308 | Tragic $80,012 |
| Chippewa | 0.0 /100 | #309 | Tragic $80,005 |
| Fijians | 0.0 /100 | #310 | Tragic $79,956 |
| Indonesians | 0.0 /100 | #311 | Tragic $79,543 |
| Immigrants | Haiti | 0.0 /100 | #312 | Tragic $79,391 |
| Menominee | 0.0 /100 | #313 | Tragic $79,358 |
| Cheyenne | 0.0 /100 | #314 | Tragic $79,152 |
| Ottawa | 0.0 /100 | #315 | Tragic $79,012 |
| Africans | 0.0 /100 | #316 | Tragic $78,986 |
| U.S. Virgin Islanders | 0.0 /100 | #317 | Tragic $78,911 |
| Immigrants | Mexico | 0.0 /100 | #318 | Tragic $78,809 |
| Hondurans | 0.0 /100 | #319 | Tragic $78,540 |
| Choctaw | 0.0 /100 | #320 | Tragic $78,168 |
| Immigrants | Zaire | 0.0 /100 | #321 | Tragic $78,045 |
| Chickasaw | 0.0 /100 | #322 | Tragic $77,929 |