Immigrants from Sudan vs Immigrants from Cameroon Householder Income Ages 25 - 44 years

COMPARE

Immigrants from Sudan
Race
Ancestry
AfghanAfricanAlaska NativeAlaskan AthabascanAlbanianAleutAlsatianAmericanApacheArabArapahoArgentineanArmenianAssyrian/Chaldean/SyriacAustralianAustrianBahamianBangladeshiBarbadianBasqueBelgianBelizeanBermudanBhutaneseBlackfeetBolivianBrazilianBritishBritish West IndianBulgarianBurmeseCajunCambodianCanadianCape VerdeanCarpatho RusynCelticCentral AmericanCentral American IndianCherokeeCheyenneChickasawChileanChineseChippewaChoctawColombianColvilleComancheCosta RicanCreeCreekCroatianCrowCubanCypriotCzechCzechoslovakianDanishDelawareDominicanDutchDutch West IndianEastern EuropeanEcuadorianEgyptianEnglishEstonianEthiopianEuropeanFijianFilipinoFinnishFrenchFrench American IndianFrench CanadianGermanGerman RussianGhanaianGreekGuamanian/ChamorroGuatemalanGuyaneseHaitianHmongHonduranHopiHoumaHungarianIcelanderIndian (Asian)IndonesianInupiatIranianIraqiIrishIroquoisIsraeliItalianJamaicanJapaneseJordanianKenyanKiowaKoreanLaotianLatvianLebaneseLiberianLithuanianLumbeeLuxembourgerMacedonianMalaysianMalteseMarshalleseMenomineeMexicanMexican American IndianMongolianMoroccanNative HawaiianNavajoNepaleseNew ZealanderNicaraguanNigerianNorthern EuropeanNorwegianOkinawanOsageOttawaPaiutePakistaniPalestinianPanamanianParaguayanPennsylvania GermanPeruvianPimaPolishPortuguesePotawatomiPuebloPuerto RicanPuget Sound SalishRomanianRussianSalvadoranSamoanScandinavianScotch-IrishScottishSeminoleSenegaleseSerbianShoshoneSierra LeoneanSiouxSlavicSlovakSloveneSomaliSouth AfricanSouth AmericanSouth American IndianSoviet UnionSpaniardSpanishSpanish AmericanSpanish American IndianSri LankanSubsaharan AfricanSudaneseSwedishSwissSyrianTaiwaneseThaiTlingit-HaidaTohono O'OdhamTonganTrinidadian and TobagonianTsimshianTurkishU.S. Virgin IslanderUgandanUkrainianUruguayanUteVenezuelanVietnameseWelshWest IndianYakamaYaquiYugoslavianYumanYup'ikZimbabwean
Immigration
NonimmigrantsImmigrantsAfghanistanAfricaAlbaniaArgentinaArmeniaAsiaAustraliaAustriaBahamasBangladeshBarbadosBelarusBelgiumBelizeBoliviaBosnia and HerzegovinaBrazilBulgariaBurma/MyanmarCabo VerdeCambodiaCanadaCaribbeanCentral AmericaChileChinaColombiaCongoCosta RicaCroatiaCubaCzechoslovakiaDenmarkDominicaDominican RepublicEastern AfricaEastern AsiaEastern EuropeEcuadorEgyptEl SalvadorEnglandEritreaEthiopiaEuropeFijiFranceGermanyGhanaGreeceGrenadaGuatemalaGuyanaHaitiHondurasHong KongHungaryIndiaIndonesiaIranIraqIrelandIsraelItalyJamaicaJapanJordanKazakhstanKenyaKoreaKuwaitLaosLatin AmericaLatviaLebanonLiberiaLithuaniaMalaysiaMexicoMicronesiaMiddle AfricaMoldovaMoroccoNepalNetherlandsNicaraguaNigeriaNorth AmericaNorth MacedoniaNorthern AfricaNorthern EuropeNorwayOceaniaPakistanPanamaPeruPhilippinesPolandPortugalRomaniaRussiaSaudi ArabiaScotlandSenegalSerbiaSierra LeoneSingaporeSomaliaSouth AfricaSouth AmericaSouth Central AsiaSouth Eastern AsiaSouthern EuropeSpainSri LankaSt. Vincent and the GrenadinesSudanSwedenSwitzerlandSyriaTaiwanThailandTrinidad and TobagoTurkeyUgandaUkraineUruguayUzbekistanVenezuelaVietnamWest IndiesWestern AfricaWestern AsiaWestern EuropeYemenZaireZimbabweAzores
Immigrants from Cameroon
Race
Ancestry
AfghanAfricanAlaska NativeAlaskan AthabascanAlbanianAleutAlsatianAmericanApacheArabArapahoArgentineanArmenianAssyrian/Chaldean/SyriacAustralianAustrianBahamianBangladeshiBarbadianBasqueBelgianBelizeanBermudanBhutaneseBlackfeetBolivianBrazilianBritishBritish West IndianBulgarianBurmeseCajunCambodianCanadianCape VerdeanCarpatho RusynCelticCentral AmericanCentral American IndianCherokeeCheyenneChickasawChileanChineseChippewaChoctawColombianColvilleComancheCosta RicanCreeCreekCroatianCrowCubanCypriotCzechCzechoslovakianDanishDelawareDominicanDutchDutch West IndianEastern EuropeanEcuadorianEgyptianEnglishEstonianEthiopianEuropeanFijianFilipinoFinnishFrenchFrench American IndianFrench CanadianGermanGerman RussianGhanaianGreekGuamanian/ChamorroGuatemalanGuyaneseHaitianHmongHonduranHopiHoumaHungarianIcelanderIndian (Asian)IndonesianInupiatIranianIraqiIrishIroquoisIsraeliItalianJamaicanJapaneseJordanianKenyanKiowaKoreanLaotianLatvianLebaneseLiberianLithuanianLumbeeLuxembourgerMacedonianMalaysianMalteseMarshalleseMenomineeMexicanMexican American IndianMongolianMoroccanNative HawaiianNavajoNepaleseNew ZealanderNicaraguanNigerianNorthern EuropeanNorwegianOkinawanOsageOttawaPaiutePakistaniPalestinianPanamanianParaguayanPennsylvania GermanPeruvianPimaPolishPortuguesePotawatomiPuebloPuerto RicanPuget Sound SalishRomanianRussianSalvadoranSamoanScandinavianScotch-IrishScottishSeminoleSenegaleseSerbianShoshoneSierra LeoneanSiouxSlavicSlovakSloveneSomaliSouth AfricanSouth AmericanSouth American IndianSoviet UnionSpaniardSpanishSpanish AmericanSpanish American IndianSri LankanSubsaharan AfricanSudaneseSwedishSwissSyrianTaiwaneseThaiTlingit-HaidaTohono O'OdhamTonganTrinidadian and TobagonianTsimshianTurkishU.S. Virgin IslanderUgandanUkrainianUruguayanUteVenezuelanVietnameseWelshWest IndianYakamaYaquiYugoslavianYumanYup'ikZimbabwean
Immigration
NonimmigrantsImmigrantsAfghanistanAfricaAlbaniaArgentinaArmeniaAsiaAustraliaAustriaBahamasBangladeshBarbadosBelarusBelgiumBelizeBoliviaBosnia and HerzegovinaBrazilBulgariaBurma/MyanmarCabo VerdeCambodiaCameroonCanadaCaribbeanCentral AmericaChileChinaColombiaCongoCosta RicaCroatiaCubaCzechoslovakiaDenmarkDominicaDominican RepublicEastern AfricaEastern AsiaEastern EuropeEcuadorEgyptEl SalvadorEnglandEritreaEthiopiaEuropeFijiFranceGermanyGhanaGreeceGrenadaGuatemalaGuyanaHaitiHondurasHong KongHungaryIndiaIndonesiaIranIraqIrelandIsraelItalyJamaicaJapanJordanKazakhstanKenyaKoreaKuwaitLaosLatin AmericaLatviaLebanonLiberiaLithuaniaMalaysiaMexicoMicronesiaMiddle AfricaMoldovaMoroccoNepalNetherlandsNicaraguaNigeriaNorth AmericaNorth MacedoniaNorthern AfricaNorthern EuropeNorwayOceaniaPakistanPanamaPeruPhilippinesPolandPortugalRomaniaRussiaSaudi ArabiaScotlandSenegalSerbiaSierra LeoneSingaporeSomaliaSouth AfricaSouth AmericaSouth Central AsiaSouth Eastern AsiaSouthern EuropeSpainSri LankaSt. Vincent and the GrenadinesSwedenSwitzerlandSyriaTaiwanThailandTrinidad and TobagoTurkeyUgandaUkraineUruguayUzbekistanVenezuelaVietnamWest IndiesWestern AfricaWestern AsiaWestern EuropeYemenZaireZimbabweAzores
Householder Income Ages 25 - 44 years
Income
Poverty
Unemployment
Labor Participation
Family Structure
Vehicle Availability
Education Level
Disability

Householder Income Ages 25 - 44 years Comparison

Immigrants from Sudan

Immigrants from Cameroon

Tragic
Tragic
$86,109
HOUSEHOLDER INCOME AGES 25 - 44 YEARS
0.9/ 100
METRIC RATING
248th/ 347
METRIC RANK
$88,214
HOUSEHOLDER INCOME AGES 25 - 44 YEARS
2.9/ 100
METRIC RATING
236th/ 347
METRIC RANK

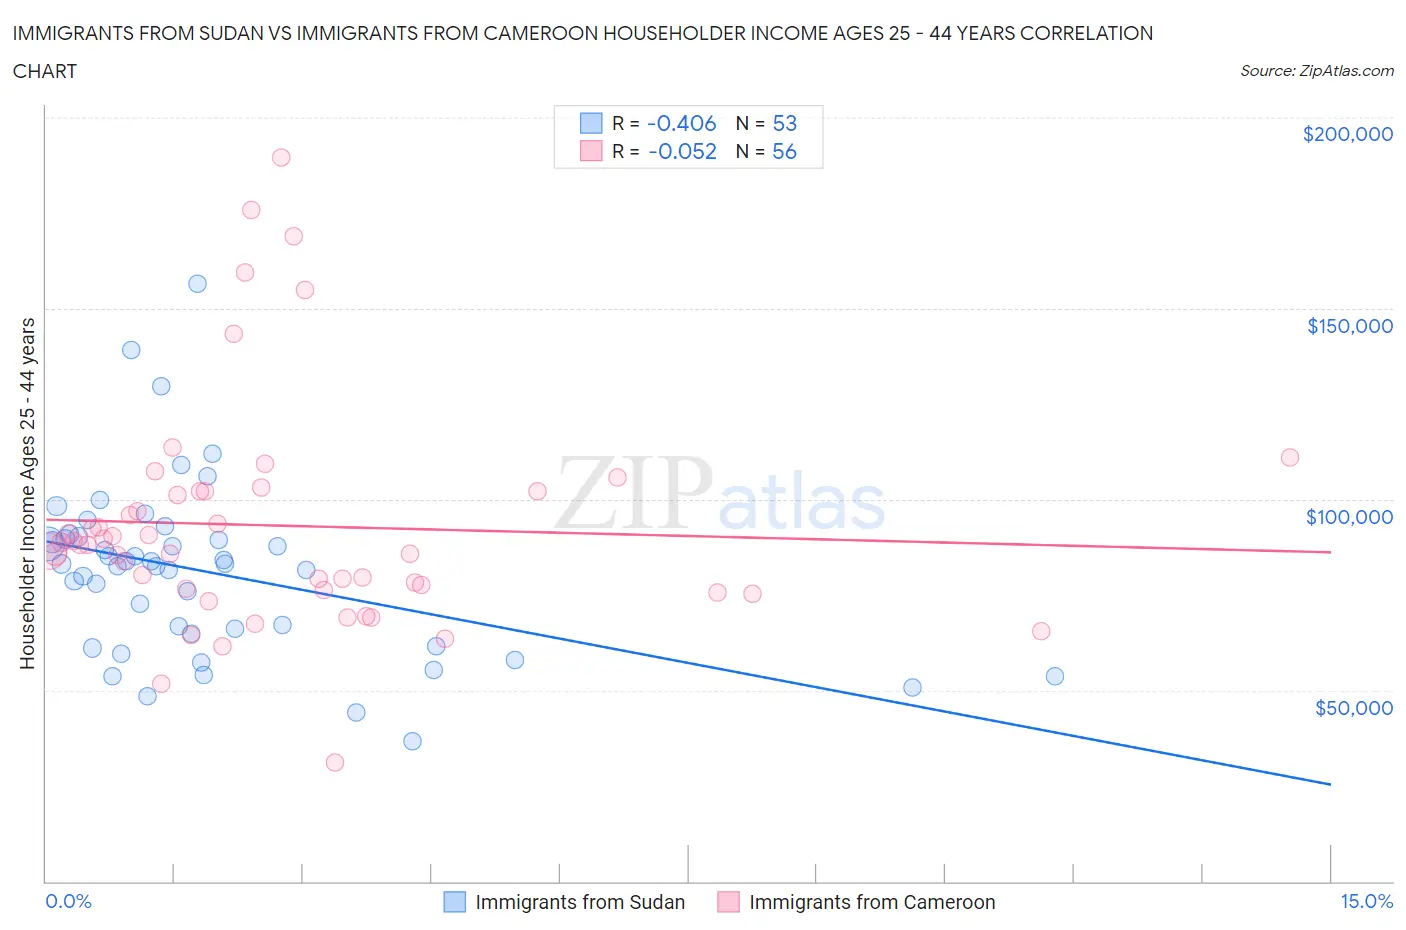
Immigrants from Sudan vs Immigrants from Cameroon Householder Income Ages 25 - 44 years Correlation Chart

The statistical analysis conducted on geographies consisting of 118,898,989 people shows a moderate negative correlation between the proportion of Immigrants from Sudan and household income with householder between the ages 25 and 44 in the United States with a correlation coefficient (R) of -0.406 and weighted average of $86,109. Similarly, the statistical analysis conducted on geographies consisting of 130,701,481 people shows a slight negative correlation between the proportion of Immigrants from Cameroon and household income with householder between the ages 25 and 44 in the United States with a correlation coefficient (R) of -0.052 and weighted average of $88,214, a difference of 2.4%.
Immigrants from Sudan vs Immigrants from Cameroon Householder Income Ages 25 - 44 years

Householder Income Ages 25 - 44 years Correlation Summary

MeasurementImmigrants from SudanImmigrants from Cameroon
Minimum$36,667$31,250
Maximum$156,518$189,447
Range$119,851$158,197
Mean$80,997$93,103
Median$83,128$88,029
Interquartile 25% (IQ1)$63,223$76,496
Interquartile 75% (IQ3)$89,871$102,206
Interquartile Range (IQR)$26,648$25,711
Standard Deviation (Sample)$22,850$29,847
Standard Deviation (Population)$22,634$29,580

Demographics Similar to Immigrants from Sudan and Immigrants from Cameroon by Householder Income Ages 25 - 44 years

In terms of householder income ages 25 - 44 years, the demographic groups most similar to Immigrants from Sudan are French American Indian ($85,899, a difference of 0.24%), Pennsylvania German ($85,836, a difference of 0.32%), Cape Verdean ($85,758, a difference of 0.41%), Immigrants from Western Africa ($85,676, a difference of 0.51%), and Immigrants from Nigeria ($86,589, a difference of 0.56%). Similarly, the demographic groups most similar to Immigrants from Cameroon are Venezuelan ($88,232, a difference of 0.020%), Bermudan ($88,231, a difference of 0.020%), Salvadoran ($88,198, a difference of 0.020%), Malaysian ($88,291, a difference of 0.090%), and Nonimmigrants ($88,301, a difference of 0.10%).
DemographicsRating | RankHouseholder Income Ages 25 - 44 years
Immigrants | Nonimmigrants
3.0
/100
|
#232
Tragic
$88,301
Malaysians
3.0
/100
|
#233
Tragic
$88,291
Venezuelans
2.9
/100
|
#234
Tragic
$88,232
Bermudans
2.9
/100
|
#235
Tragic
$88,231
Immigrants | Cameroon
2.9
/100
|
#236
Tragic
$88,214
Salvadorans
2.8
/100
|
#237
Tragic
$88,198
Alaska Natives
2.6
/100
|
#238
Tragic
$88,018
Immigrants | Ghana
2.2
/100
|
#239
Tragic
$87,760
Nicaraguans
2.2
/100
|
#240
Tragic
$87,751
Nigerians
2.2
/100
|
#241
Tragic
$87,730
West Indians
1.7
/100
|
#242
Tragic
$87,205
Immigrants | West Indies
1.5
/100
|
#243
Tragic
$87,063
Immigrants | Venezuela
1.5
/100
|
#244
Tragic
$87,038
Immigrants | El Salvador
1.4
/100
|
#245
Tragic
$86,913
Immigrants | Burma/Myanmar
1.3
/100
|
#246
Tragic
$86,736
Immigrants | Nigeria
1.2
/100
|
#247
Tragic
$86,589
Immigrants | Sudan
0.9
/100
|
#248
Tragic
$86,109
French American Indians
0.8
/100
|
#249
Tragic
$85,899
Pennsylvania Germans
0.8
/100
|
#250
Tragic
$85,836
Cape Verdeans
0.8
/100
|
#251
Tragic
$85,758
Immigrants | Western Africa
0.7
/100
|
#252
Tragic
$85,676