Immigrants from Sudan vs Ottawa In Labor Force | Age 16-19
COMPARE
Immigrants from Sudan
Ottawa
In Labor Force | Age 16-19
In Labor Force | Age 16-19 Comparison
Immigrants from Sudan
Ottawa
41.0%
IN LABOR FORCE | AGE 16-19
100.0/ 100
METRIC RATING
46th/ 347
METRIC RANK
43.0%
IN LABOR FORCE | AGE 16-19
100.0/ 100
METRIC RATING
21st/ 347
METRIC RANK
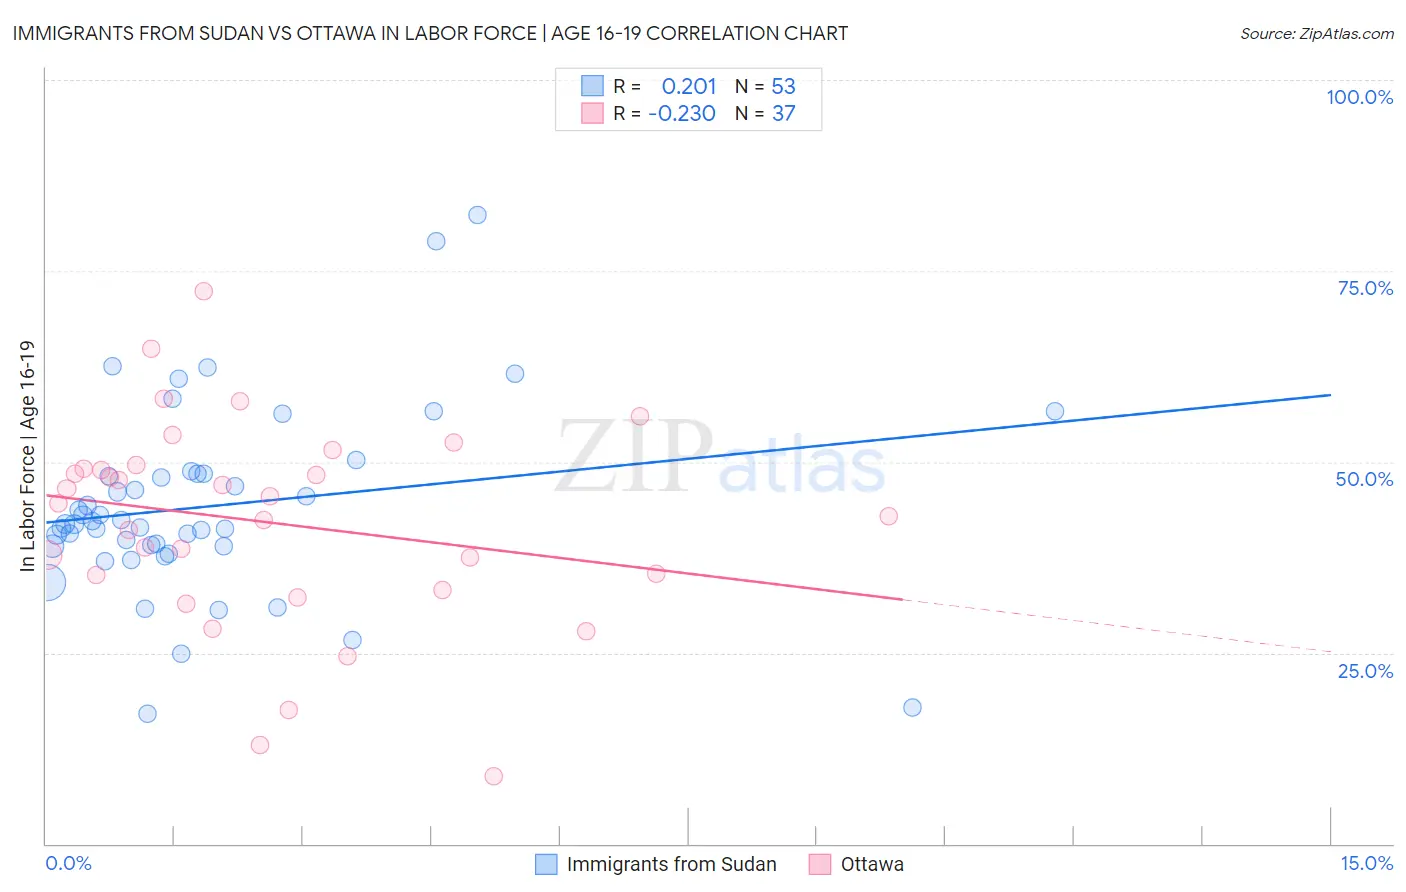
Immigrants from Sudan vs Ottawa In Labor Force | Age 16-19 Correlation Chart
The statistical analysis conducted on geographies consisting of 118,958,697 people shows a weak positive correlation between the proportion of Immigrants from Sudan and labor force participation rate among population between the ages 16 and 19 in the United States with a correlation coefficient (R) of 0.201 and weighted average of 41.0%. Similarly, the statistical analysis conducted on geographies consisting of 49,923,011 people shows a weak negative correlation between the proportion of Ottawa and labor force participation rate among population between the ages 16 and 19 in the United States with a correlation coefficient (R) of -0.230 and weighted average of 43.0%, a difference of 5.0%.
In Labor Force | Age 16-19 Correlation Summary
| Measurement | Immigrants from Sudan | Ottawa |
| Minimum | 17.1% | 8.9% |
| Maximum | 82.3% | 72.4% |
| Range | 65.2% | 63.5% |
| Mean | 44.2% | 42.1% |
| Median | 41.9% | 44.5% |
| Interquartile 25% (IQ1) | 39.0% | 34.3% |
| Interquartile 75% (IQ3) | 48.5% | 49.3% |
| Interquartile Range (IQR) | 9.5% | 15.1% |
| Standard Deviation (Sample) | 12.3% | 13.5% |
| Standard Deviation (Population) | 12.2% | 13.3% |
Similar Demographics by In Labor Force | Age 16-19
Demographics Similar to Immigrants from Sudan by In Labor Force | Age 16-19
In terms of in labor force | age 16-19, the demographic groups most similar to Immigrants from Sudan are Croatian (41.1%, a difference of 0.32%), European (41.1%, a difference of 0.36%), Tongan (41.2%, a difference of 0.46%), Carpatho Rusyn (40.8%, a difference of 0.47%), and Icelander (40.8%, a difference of 0.52%).
| Demographics | Rating | Rank | In Labor Force | Age 16-19 |
| Scotch-Irish | 100.0 /100 | #39 | Exceptional 41.5% |
| Immigrants | Liberia | 100.0 /100 | #40 | Exceptional 41.5% |
| Celtics | 100.0 /100 | #41 | Exceptional 41.3% |
| Whites/Caucasians | 100.0 /100 | #42 | Exceptional 41.3% |
| Tongans | 100.0 /100 | #43 | Exceptional 41.2% |
| Europeans | 100.0 /100 | #44 | Exceptional 41.1% |
| Croatians | 100.0 /100 | #45 | Exceptional 41.1% |
| Immigrants | Sudan | 100.0 /100 | #46 | Exceptional 41.0% |
| Carpatho Rusyns | 100.0 /100 | #47 | Exceptional 40.8% |
| Icelanders | 100.0 /100 | #48 | Exceptional 40.8% |
| Cree | 100.0 /100 | #49 | Exceptional 40.8% |
| Indonesians | 100.0 /100 | #50 | Exceptional 40.7% |
| Immigrants | Zaire | 100.0 /100 | #51 | Exceptional 40.7% |
| Immigrants | Laos | 100.0 /100 | #52 | Exceptional 40.6% |
| Immigrants | Kenya | 100.0 /100 | #53 | Exceptional 40.5% |
Demographics Similar to Ottawa by In Labor Force | Age 16-19
In terms of in labor force | age 16-19, the demographic groups most similar to Ottawa are Sudanese (42.9%, a difference of 0.40%), Swiss (43.3%, a difference of 0.56%), Belgian (43.4%, a difference of 0.78%), Slovak (42.6%, a difference of 0.99%), and French Canadian (43.6%, a difference of 1.3%).
| Demographics | Rating | Rank | In Labor Force | Age 16-19 |
| Chippewa | 100.0 /100 | #14 | Exceptional 43.8% |
| Slovenes | 100.0 /100 | #15 | Exceptional 43.7% |
| Czechs | 100.0 /100 | #16 | Exceptional 43.6% |
| Scandinavians | 100.0 /100 | #17 | Exceptional 43.6% |
| French Canadians | 100.0 /100 | #18 | Exceptional 43.6% |
| Belgians | 100.0 /100 | #19 | Exceptional 43.4% |
| Swiss | 100.0 /100 | #20 | Exceptional 43.3% |
| Ottawa | 100.0 /100 | #21 | Exceptional 43.0% |
| Sudanese | 100.0 /100 | #22 | Exceptional 42.9% |
| Slovaks | 100.0 /100 | #23 | Exceptional 42.6% |
| Bangladeshis | 100.0 /100 | #24 | Exceptional 42.5% |
| German Russians | 100.0 /100 | #25 | Exceptional 42.4% |
| English | 100.0 /100 | #26 | Exceptional 42.4% |
| Welsh | 100.0 /100 | #27 | Exceptional 42.3% |
| Poles | 100.0 /100 | #28 | Exceptional 42.1% |