Arab vs Ottawa Householder Income Ages 25 - 44 years
COMPARE
Arab
Ottawa
Householder Income Ages 25 - 44 years
Householder Income Ages 25 - 44 years Comparison
Arabs
Ottawa
$97,336
HOUSEHOLDER INCOME AGES 25 - 44 YEARS
82.3/ 100
METRIC RATING
138th/ 347
METRIC RANK
$79,012
HOUSEHOLDER INCOME AGES 25 - 44 YEARS
0.0/ 100
METRIC RATING
315th/ 347
METRIC RANK
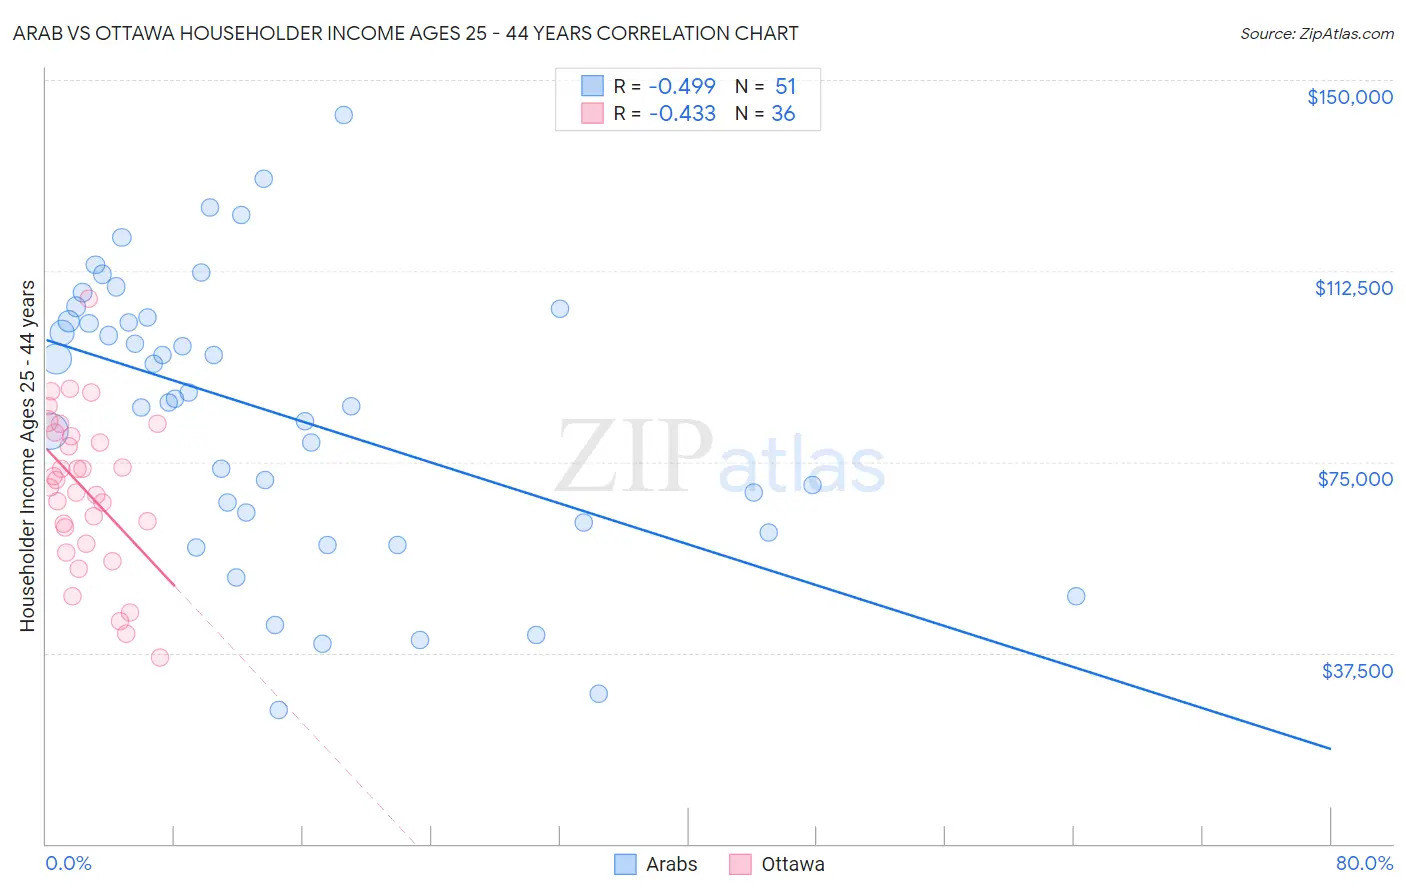
Arab vs Ottawa Householder Income Ages 25 - 44 years Correlation Chart
The statistical analysis conducted on geographies consisting of 484,835,242 people shows a moderate negative correlation between the proportion of Arabs and household income with householder between the ages 25 and 44 in the United States with a correlation coefficient (R) of -0.499 and weighted average of $97,336. Similarly, the statistical analysis conducted on geographies consisting of 49,887,469 people shows a moderate negative correlation between the proportion of Ottawa and household income with householder between the ages 25 and 44 in the United States with a correlation coefficient (R) of -0.433 and weighted average of $79,012, a difference of 23.2%.
Householder Income Ages 25 - 44 years Correlation Summary
| Measurement | Arab | Ottawa |
| Minimum | $26,250 | $36,563 |
| Maximum | $143,125 | $106,935 |
| Range | $116,875 | $70,372 |
| Mean | $84,482 | $69,424 |
| Median | $87,286 | $70,740 |
| Interquartile 25% (IQ1) | $63,008 | $60,457 |
| Interquartile 75% (IQ3) | $103,414 | $80,364 |
| Interquartile Range (IQR) | $40,406 | $19,907 |
| Standard Deviation (Sample) | $27,531 | $15,349 |
| Standard Deviation (Population) | $27,260 | $15,134 |
Similar Demographics by Householder Income Ages 25 - 44 years
Demographics Similar to Arabs by Householder Income Ages 25 - 44 years
In terms of householder income ages 25 - 44 years, the demographic groups most similar to Arabs are Lebanese ($97,339, a difference of 0.0%), Immigrants from Peru ($97,329, a difference of 0.010%), Immigrants from Morocco ($97,305, a difference of 0.030%), Luxembourger ($97,237, a difference of 0.10%), and Danish ($97,221, a difference of 0.12%).
| Demographics | Rating | Rank | Householder Income Ages 25 - 44 years |
| Immigrants | Albania | 86.6 /100 | #131 | Excellent $97,929 |
| Immigrants | Zimbabwe | 86.3 /100 | #132 | Excellent $97,880 |
| Tsimshian | 85.8 /100 | #133 | Excellent $97,809 |
| Canadians | 84.5 /100 | #134 | Excellent $97,625 |
| Immigrants | Oceania | 84.5 /100 | #135 | Excellent $97,623 |
| Hungarians | 83.9 /100 | #136 | Excellent $97,544 |
| Lebanese | 82.3 /100 | #137 | Excellent $97,339 |
| Arabs | 82.3 /100 | #138 | Excellent $97,336 |
| Immigrants | Peru | 82.2 /100 | #139 | Excellent $97,329 |
| Immigrants | Morocco | 82.0 /100 | #140 | Excellent $97,305 |
| Luxembourgers | 81.5 /100 | #141 | Excellent $97,237 |
| Danes | 81.3 /100 | #142 | Excellent $97,221 |
| Immigrants | Jordan | 81.0 /100 | #143 | Excellent $97,185 |
| Immigrants | Chile | 80.8 /100 | #144 | Excellent $97,159 |
| Norwegians | 78.2 /100 | #145 | Good $96,866 |
Demographics Similar to Ottawa by Householder Income Ages 25 - 44 years
In terms of householder income ages 25 - 44 years, the demographic groups most similar to Ottawa are African ($78,986, a difference of 0.030%), U.S. Virgin Islander ($78,911, a difference of 0.13%), Cheyenne ($79,152, a difference of 0.18%), Immigrants from Mexico ($78,809, a difference of 0.26%), and Menominee ($79,358, a difference of 0.44%).
| Demographics | Rating | Rank | Householder Income Ages 25 - 44 years |
| Immigrants | Central America | 0.0 /100 | #308 | Tragic $80,012 |
| Chippewa | 0.0 /100 | #309 | Tragic $80,005 |
| Fijians | 0.0 /100 | #310 | Tragic $79,956 |
| Indonesians | 0.0 /100 | #311 | Tragic $79,543 |
| Immigrants | Haiti | 0.0 /100 | #312 | Tragic $79,391 |
| Menominee | 0.0 /100 | #313 | Tragic $79,358 |
| Cheyenne | 0.0 /100 | #314 | Tragic $79,152 |
| Ottawa | 0.0 /100 | #315 | Tragic $79,012 |
| Africans | 0.0 /100 | #316 | Tragic $78,986 |
| U.S. Virgin Islanders | 0.0 /100 | #317 | Tragic $78,911 |
| Immigrants | Mexico | 0.0 /100 | #318 | Tragic $78,809 |
| Hondurans | 0.0 /100 | #319 | Tragic $78,540 |
| Choctaw | 0.0 /100 | #320 | Tragic $78,168 |
| Immigrants | Zaire | 0.0 /100 | #321 | Tragic $78,045 |
| Chickasaw | 0.0 /100 | #322 | Tragic $77,929 |