Liberian vs Ottawa Householder Income Ages 25 - 44 years
COMPARE
Liberian
Ottawa
Householder Income Ages 25 - 44 years
Householder Income Ages 25 - 44 years Comparison
Liberians
Ottawa
$82,005
HOUSEHOLDER INCOME AGES 25 - 44 YEARS
0.1/ 100
METRIC RATING
290th/ 347
METRIC RANK
$79,012
HOUSEHOLDER INCOME AGES 25 - 44 YEARS
0.0/ 100
METRIC RATING
315th/ 347
METRIC RANK
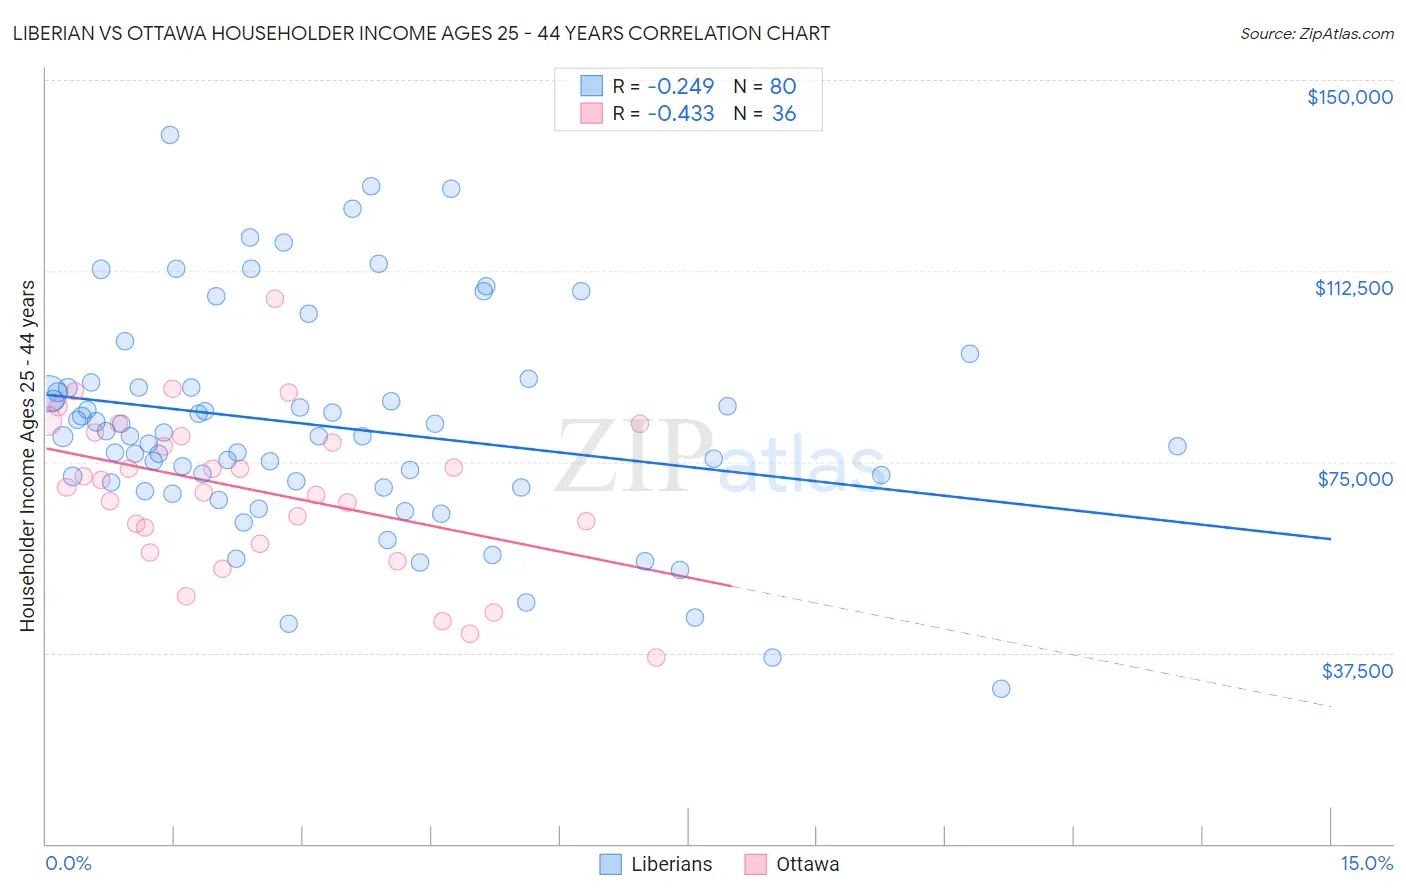
Liberian vs Ottawa Householder Income Ages 25 - 44 years Correlation Chart
The statistical analysis conducted on geographies consisting of 117,996,712 people shows a weak negative correlation between the proportion of Liberians and household income with householder between the ages 25 and 44 in the United States with a correlation coefficient (R) of -0.249 and weighted average of $82,005. Similarly, the statistical analysis conducted on geographies consisting of 49,887,469 people shows a moderate negative correlation between the proportion of Ottawa and household income with householder between the ages 25 and 44 in the United States with a correlation coefficient (R) of -0.433 and weighted average of $79,012, a difference of 3.8%.
Householder Income Ages 25 - 44 years Correlation Summary
| Measurement | Liberian | Ottawa |
| Minimum | $30,517 | $36,563 |
| Maximum | $139,167 | $106,935 |
| Range | $108,650 | $70,372 |
| Mean | $82,112 | $69,424 |
| Median | $80,107 | $70,740 |
| Interquartile 25% (IQ1) | $70,490 | $60,457 |
| Interquartile 75% (IQ3) | $89,678 | $80,364 |
| Interquartile Range (IQR) | $19,188 | $19,907 |
| Standard Deviation (Sample) | $21,404 | $15,349 |
| Standard Deviation (Population) | $21,270 | $15,134 |
Similar Demographics by Householder Income Ages 25 - 44 years
Demographics Similar to Liberians by Householder Income Ages 25 - 44 years
In terms of householder income ages 25 - 44 years, the demographic groups most similar to Liberians are Shoshone ($82,062, a difference of 0.070%), Comanche ($82,152, a difference of 0.18%), Ute ($82,166, a difference of 0.20%), Immigrants from Latin America ($82,166, a difference of 0.20%), and Immigrants from Somalia ($82,188, a difference of 0.22%).
| Demographics | Rating | Rank | Householder Income Ages 25 - 44 years |
| Guatemalans | 0.1 /100 | #283 | Tragic $82,331 |
| Immigrants | Middle Africa | 0.1 /100 | #284 | Tragic $82,254 |
| Immigrants | Somalia | 0.1 /100 | #285 | Tragic $82,188 |
| Ute | 0.1 /100 | #286 | Tragic $82,166 |
| Immigrants | Latin America | 0.1 /100 | #287 | Tragic $82,166 |
| Comanche | 0.1 /100 | #288 | Tragic $82,152 |
| Shoshone | 0.1 /100 | #289 | Tragic $82,062 |
| Liberians | 0.1 /100 | #290 | Tragic $82,005 |
| Potawatomi | 0.1 /100 | #291 | Tragic $81,774 |
| Yaqui | 0.1 /100 | #292 | Tragic $81,656 |
| Blackfeet | 0.1 /100 | #293 | Tragic $81,531 |
| Cubans | 0.1 /100 | #294 | Tragic $81,483 |
| Bangladeshis | 0.1 /100 | #295 | Tragic $81,363 |
| Immigrants | Dominica | 0.1 /100 | #296 | Tragic $81,351 |
| Immigrants | Guatemala | 0.1 /100 | #297 | Tragic $81,341 |
Demographics Similar to Ottawa by Householder Income Ages 25 - 44 years
In terms of householder income ages 25 - 44 years, the demographic groups most similar to Ottawa are African ($78,986, a difference of 0.030%), U.S. Virgin Islander ($78,911, a difference of 0.13%), Cheyenne ($79,152, a difference of 0.18%), Immigrants from Mexico ($78,809, a difference of 0.26%), and Menominee ($79,358, a difference of 0.44%).
| Demographics | Rating | Rank | Householder Income Ages 25 - 44 years |
| Immigrants | Central America | 0.0 /100 | #308 | Tragic $80,012 |
| Chippewa | 0.0 /100 | #309 | Tragic $80,005 |
| Fijians | 0.0 /100 | #310 | Tragic $79,956 |
| Indonesians | 0.0 /100 | #311 | Tragic $79,543 |
| Immigrants | Haiti | 0.0 /100 | #312 | Tragic $79,391 |
| Menominee | 0.0 /100 | #313 | Tragic $79,358 |
| Cheyenne | 0.0 /100 | #314 | Tragic $79,152 |
| Ottawa | 0.0 /100 | #315 | Tragic $79,012 |
| Africans | 0.0 /100 | #316 | Tragic $78,986 |
| U.S. Virgin Islanders | 0.0 /100 | #317 | Tragic $78,911 |
| Immigrants | Mexico | 0.0 /100 | #318 | Tragic $78,809 |
| Hondurans | 0.0 /100 | #319 | Tragic $78,540 |
| Choctaw | 0.0 /100 | #320 | Tragic $78,168 |
| Immigrants | Zaire | 0.0 /100 | #321 | Tragic $78,045 |
| Chickasaw | 0.0 /100 | #322 | Tragic $77,929 |