Immigrants from Sri Lanka vs Immigrants from Dominican Republic 1 or more Vehicles in Household
COMPARE
Immigrants from Sri Lanka
Immigrants from Dominican Republic
1 or more Vehicles in Household
1 or more Vehicles in Household Comparison
Immigrants from Sri Lanka
Immigrants from Dominican Republic
88.9%
1 OR MORE VEHICLES IN HOUSEHOLD
10.2/ 100
METRIC RATING
215th/ 347
METRIC RANK
68.6%
1 OR MORE VEHICLES IN HOUSEHOLD
0.0/ 100
METRIC RATING
344th/ 347
METRIC RANK
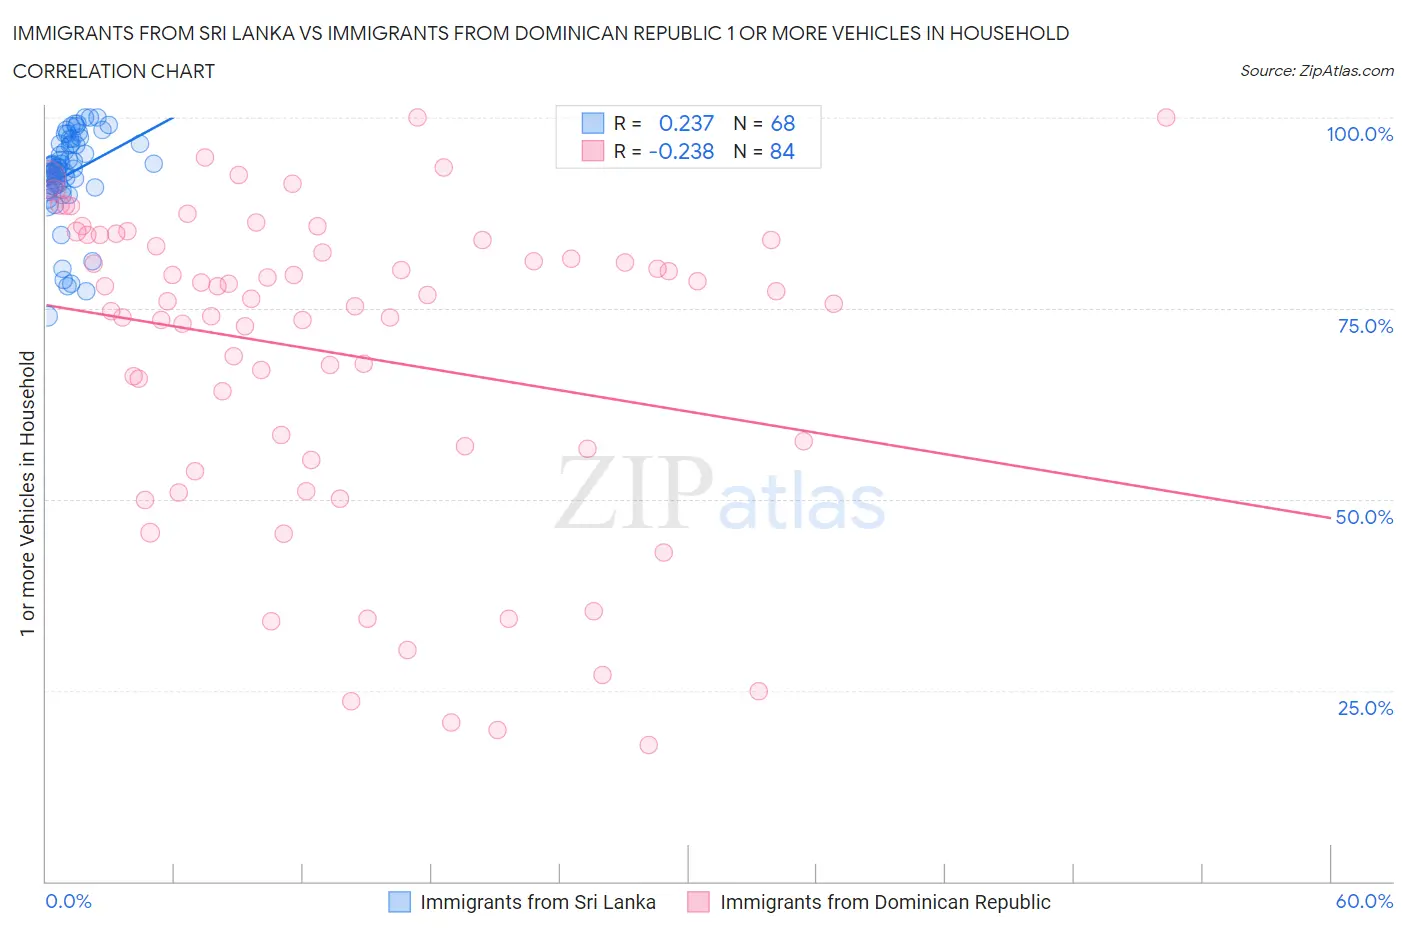
Immigrants from Sri Lanka vs Immigrants from Dominican Republic 1 or more Vehicles in Household Correlation Chart
The statistical analysis conducted on geographies consisting of 149,664,383 people shows a weak positive correlation between the proportion of Immigrants from Sri Lanka and percentage of households with 1 or more vehicles available in the United States with a correlation coefficient (R) of 0.237 and weighted average of 88.9%. Similarly, the statistical analysis conducted on geographies consisting of 274,977,350 people shows a weak negative correlation between the proportion of Immigrants from Dominican Republic and percentage of households with 1 or more vehicles available in the United States with a correlation coefficient (R) of -0.238 and weighted average of 68.6%, a difference of 29.6%.
1 or more Vehicles in Household Correlation Summary
| Measurement | Immigrants from Sri Lanka | Immigrants from Dominican Republic |
| Minimum | 74.0% | 17.9% |
| Maximum | 100.0% | 100.0% |
| Range | 26.0% | 82.1% |
| Mean | 92.6% | 69.1% |
| Median | 93.5% | 76.1% |
| Interquartile 25% (IQ1) | 90.9% | 56.8% |
| Interquartile 75% (IQ3) | 96.6% | 84.0% |
| Interquartile Range (IQR) | 5.7% | 27.2% |
| Standard Deviation (Sample) | 5.9% | 20.6% |
| Standard Deviation (Population) | 5.9% | 20.5% |
Similar Demographics by 1 or more Vehicles in Household
Demographics Similar to Immigrants from Sri Lanka by 1 or more Vehicles in Household
In terms of 1 or more vehicles in household, the demographic groups most similar to Immigrants from Sri Lanka are Immigrants from Argentina (88.9%, a difference of 0.030%), Argentinean (88.9%, a difference of 0.060%), Immigrants from Hungary (89.0%, a difference of 0.070%), Ugandan (88.9%, a difference of 0.070%), and Immigrants from Guatemala (88.9%, a difference of 0.070%).
| Demographics | Rating | Rank | 1 or more Vehicles in Household |
| Immigrants | Chile | 14.4 /100 | #208 | Poor 89.1% |
| Immigrants | Italy | 14.0 /100 | #209 | Poor 89.1% |
| Dutch West Indians | 13.5 /100 | #210 | Poor 89.0% |
| Sierra Leoneans | 13.0 /100 | #211 | Poor 89.0% |
| Somalis | 12.8 /100 | #212 | Poor 89.0% |
| Immigrants | Western Asia | 12.3 /100 | #213 | Poor 89.0% |
| Immigrants | Hungary | 11.9 /100 | #214 | Poor 89.0% |
| Immigrants | Sri Lanka | 10.2 /100 | #215 | Poor 88.9% |
| Immigrants | Argentina | 9.4 /100 | #216 | Tragic 88.9% |
| Argentineans | 8.8 /100 | #217 | Tragic 88.9% |
| Ugandans | 8.7 /100 | #218 | Tragic 88.9% |
| Immigrants | Guatemala | 8.6 /100 | #219 | Tragic 88.9% |
| Immigrants | Zaire | 8.1 /100 | #220 | Tragic 88.8% |
| Peruvians | 7.9 /100 | #221 | Tragic 88.8% |
| Uruguayans | 7.0 /100 | #222 | Tragic 88.8% |
Demographics Similar to Immigrants from Dominican Republic by 1 or more Vehicles in Household
In terms of 1 or more vehicles in household, the demographic groups most similar to Immigrants from Dominican Republic are British West Indian (70.4%, a difference of 2.5%), Immigrants from Guyana (70.6%, a difference of 2.8%), Immigrants from Barbados (70.6%, a difference of 2.8%), Dominican (70.7%, a difference of 3.0%), and Guyanese (70.8%, a difference of 3.2%).
| Demographics | Rating | Rank | 1 or more Vehicles in Household |
| Immigrants | Ecuador | 0.0 /100 | #333 | Tragic 76.2% |
| Immigrants | Bangladesh | 0.0 /100 | #334 | Tragic 74.3% |
| Barbadians | 0.0 /100 | #335 | Tragic 74.0% |
| Vietnamese | 0.0 /100 | #336 | Tragic 73.8% |
| Immigrants | Uzbekistan | 0.0 /100 | #337 | Tragic 73.4% |
| Inupiat | 0.0 /100 | #338 | Tragic 71.5% |
| Guyanese | 0.0 /100 | #339 | Tragic 70.8% |
| Dominicans | 0.0 /100 | #340 | Tragic 70.7% |
| Immigrants | Barbados | 0.0 /100 | #341 | Tragic 70.6% |
| Immigrants | Guyana | 0.0 /100 | #342 | Tragic 70.6% |
| British West Indians | 0.0 /100 | #343 | Tragic 70.4% |
| Immigrants | Dominican Republic | 0.0 /100 | #344 | Tragic 68.6% |
| Immigrants | St. Vincent and the Grenadines | 0.0 /100 | #345 | Tragic 64.7% |
| Immigrants | Grenada | 0.0 /100 | #346 | Tragic 62.7% |
| Yup'ik | 0.0 /100 | #347 | Tragic 58.4% |