Immigrants from Sri Lanka vs Sioux Wage/Income Gap
COMPARE
Immigrants from Sri Lanka
Sioux
Wage/Income Gap
Wage/Income Gap Comparison
Immigrants from Sri Lanka
Sioux
27.1%
WAGE/INCOME GAP
3.7/ 100
METRIC RATING
242nd/ 347
METRIC RANK
24.3%
WAGE/INCOME GAP
96.9/ 100
METRIC RATING
113th/ 347
METRIC RANK
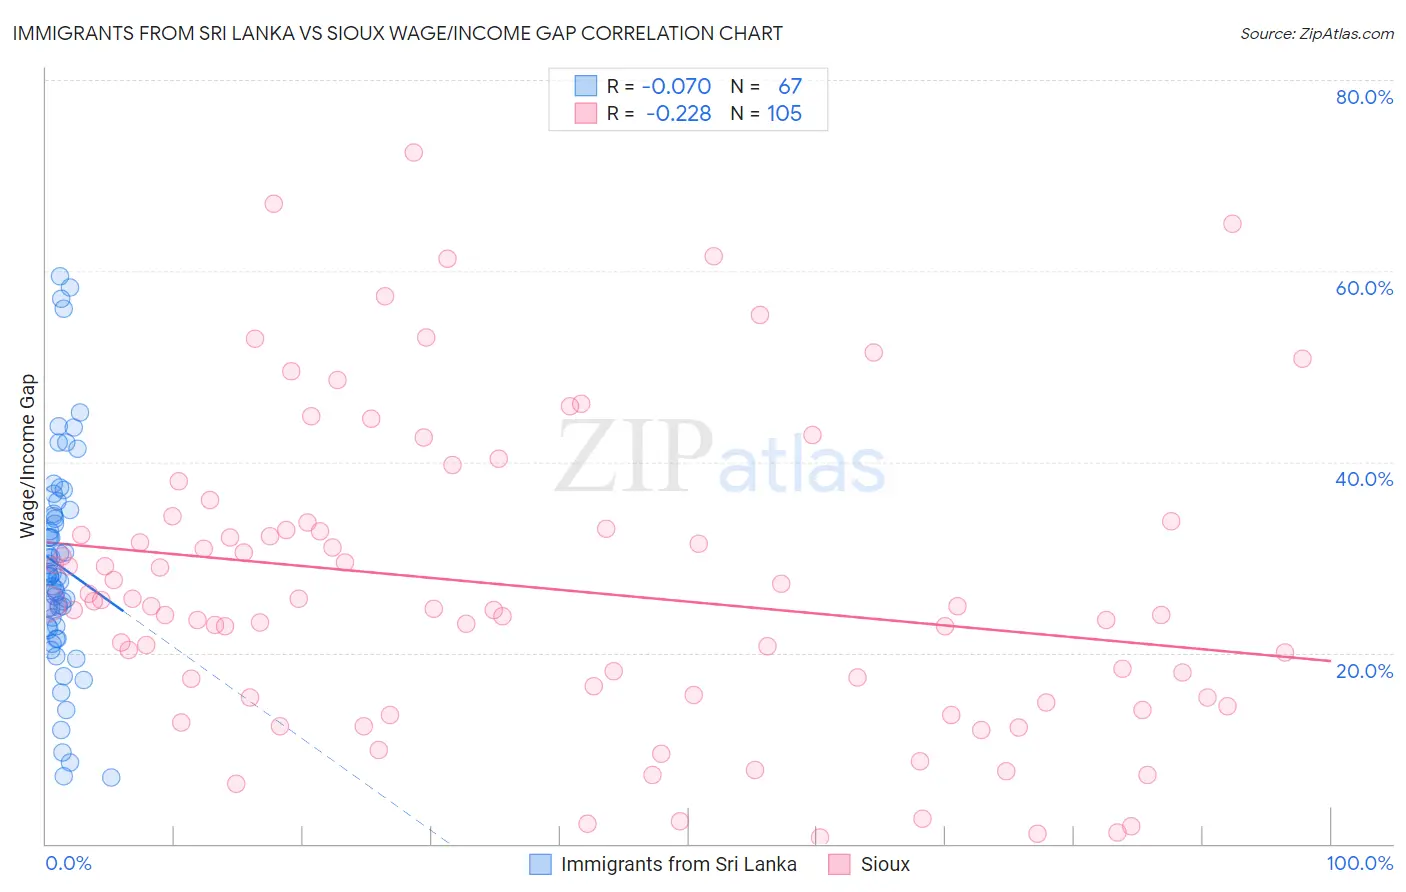
Immigrants from Sri Lanka vs Sioux Wage/Income Gap Correlation Chart
The statistical analysis conducted on geographies consisting of 149,684,649 people shows a slight negative correlation between the proportion of Immigrants from Sri Lanka and wage/income gap percentage in the United States with a correlation coefficient (R) of -0.070 and weighted average of 27.1%. Similarly, the statistical analysis conducted on geographies consisting of 233,992,822 people shows a weak negative correlation between the proportion of Sioux and wage/income gap percentage in the United States with a correlation coefficient (R) of -0.228 and weighted average of 24.3%, a difference of 11.6%.
Wage/Income Gap Correlation Summary
| Measurement | Immigrants from Sri Lanka | Sioux |
| Minimum | 7.0% | 0.72% |
| Maximum | 59.4% | 72.4% |
| Range | 52.4% | 71.7% |
| Mean | 29.2% | 26.9% |
| Median | 28.0% | 24.9% |
| Interquartile 25% (IQ1) | 22.7% | 15.3% |
| Interquartile 75% (IQ3) | 34.6% | 33.4% |
| Interquartile Range (IQR) | 11.8% | 18.1% |
| Standard Deviation (Sample) | 11.3% | 15.9% |
| Standard Deviation (Population) | 11.2% | 15.8% |
Similar Demographics by Wage/Income Gap
Demographics Similar to Immigrants from Sri Lanka by Wage/Income Gap
In terms of wage/income gap, the demographic groups most similar to Immigrants from Sri Lanka are Spanish (27.1%, a difference of 0.010%), Creek (27.1%, a difference of 0.050%), Immigrants from Europe (27.1%, a difference of 0.070%), Chickasaw (27.2%, a difference of 0.080%), and Immigrants from the Azores (27.2%, a difference of 0.090%).
| Demographics | Rating | Rank | Wage/Income Gap |
| Immigrants | Hungary | 4.8 /100 | #235 | Tragic 27.0% |
| Immigrants | Romania | 4.8 /100 | #236 | Tragic 27.0% |
| Immigrants | Eastern Asia | 4.4 /100 | #237 | Tragic 27.1% |
| Osage | 4.4 /100 | #238 | Tragic 27.1% |
| Estonians | 4.3 /100 | #239 | Tragic 27.1% |
| Immigrants | Europe | 3.8 /100 | #240 | Tragic 27.1% |
| Creek | 3.8 /100 | #241 | Tragic 27.1% |
| Immigrants | Sri Lanka | 3.7 /100 | #242 | Tragic 27.1% |
| Spanish | 3.6 /100 | #243 | Tragic 27.1% |
| Chickasaw | 3.5 /100 | #244 | Tragic 27.2% |
| Immigrants | Azores | 3.5 /100 | #245 | Tragic 27.2% |
| Immigrants | Nonimmigrants | 3.3 /100 | #246 | Tragic 27.2% |
| Celtics | 2.8 /100 | #247 | Tragic 27.3% |
| Cypriots | 2.8 /100 | #248 | Tragic 27.3% |
| Carpatho Rusyns | 2.7 /100 | #249 | Tragic 27.3% |
Demographics Similar to Sioux by Wage/Income Gap
In terms of wage/income gap, the demographic groups most similar to Sioux are Immigrants from Colombia (24.3%, a difference of 0.050%), Panamanian (24.4%, a difference of 0.20%), Immigrants from Kenya (24.4%, a difference of 0.26%), Alaska Native (24.4%, a difference of 0.43%), and Soviet Union (24.2%, a difference of 0.45%).
| Demographics | Rating | Rank | Wage/Income Gap |
| Sudanese | 98.6 /100 | #106 | Exceptional 24.0% |
| Yaqui | 98.4 /100 | #107 | Exceptional 24.0% |
| Immigrants | Albania | 98.4 /100 | #108 | Exceptional 24.0% |
| Ugandans | 98.3 /100 | #109 | Exceptional 24.1% |
| Immigrants | Morocco | 98.1 /100 | #110 | Exceptional 24.1% |
| Soviet Union | 97.6 /100 | #111 | Exceptional 24.2% |
| Immigrants | Colombia | 97.0 /100 | #112 | Exceptional 24.3% |
| Sioux | 96.9 /100 | #113 | Exceptional 24.3% |
| Panamanians | 96.5 /100 | #114 | Exceptional 24.4% |
| Immigrants | Kenya | 96.4 /100 | #115 | Exceptional 24.4% |
| Alaska Natives | 96.0 /100 | #116 | Exceptional 24.4% |
| Immigrants | Afghanistan | 95.9 /100 | #117 | Exceptional 24.4% |
| Immigrants | Micronesia | 95.8 /100 | #118 | Exceptional 24.4% |
| Kenyans | 95.8 /100 | #119 | Exceptional 24.5% |
| Cree | 95.6 /100 | #120 | Exceptional 24.5% |