Immigrants from Spain vs Immigrants from Pakistan Householder Income Ages 25 - 44 years
COMPARE
Immigrants from Spain
Immigrants from Pakistan
Householder Income Ages 25 - 44 years
Householder Income Ages 25 - 44 years Comparison
Immigrants from Spain
Immigrants from Pakistan
$103,752
HOUSEHOLDER INCOME AGES 25 - 44 YEARS
99.4/ 100
METRIC RATING
76th/ 347
METRIC RANK
$106,129
HOUSEHOLDER INCOME AGES 25 - 44 YEARS
99.8/ 100
METRIC RATING
56th/ 347
METRIC RANK
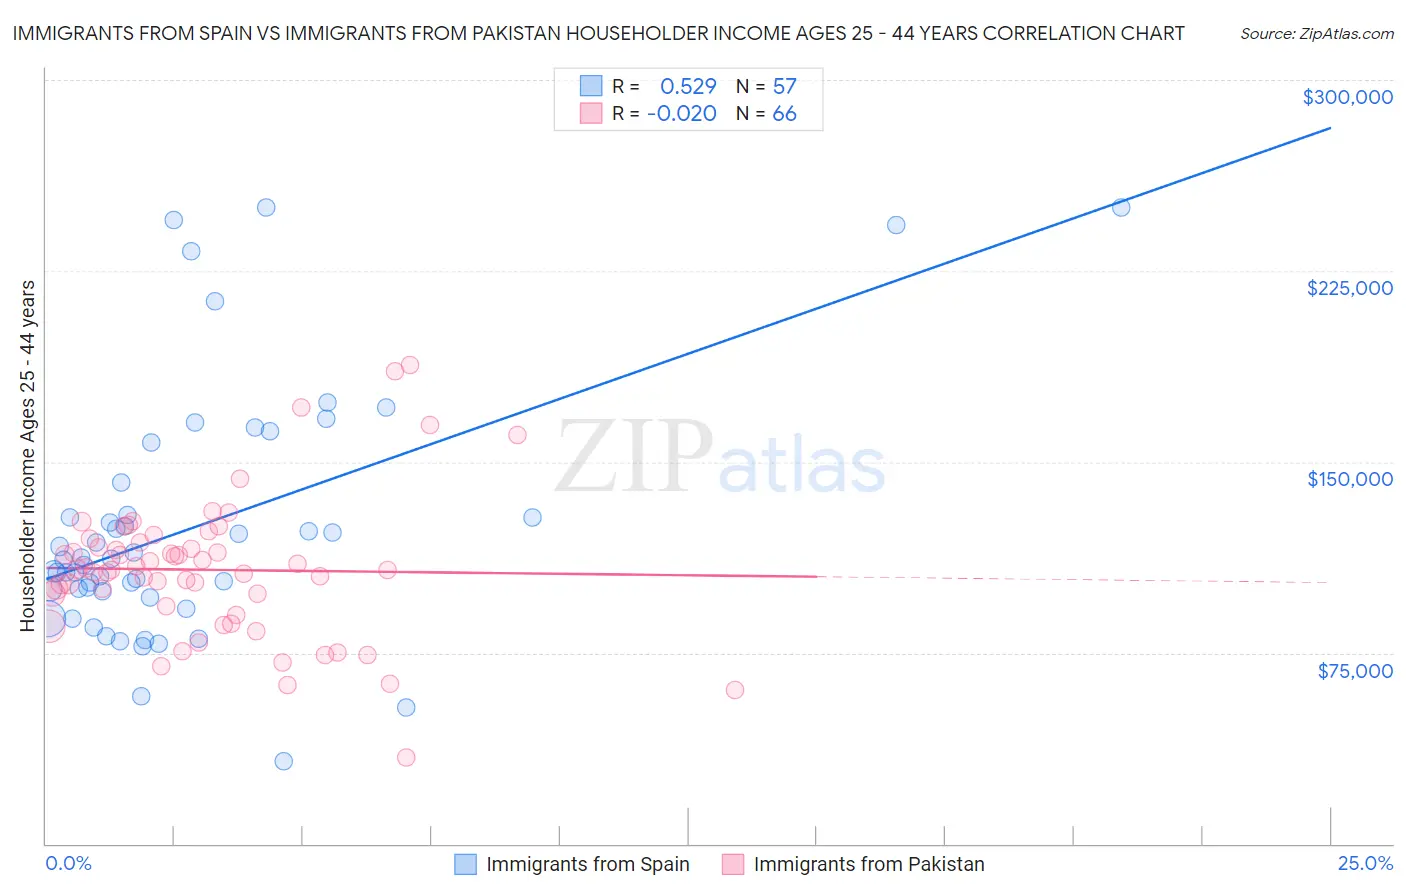
Immigrants from Spain vs Immigrants from Pakistan Householder Income Ages 25 - 44 years Correlation Chart
The statistical analysis conducted on geographies consisting of 239,393,463 people shows a substantial positive correlation between the proportion of Immigrants from Spain and household income with householder between the ages 25 and 44 in the United States with a correlation coefficient (R) of 0.529 and weighted average of $103,752. Similarly, the statistical analysis conducted on geographies consisting of 283,570,722 people shows no correlation between the proportion of Immigrants from Pakistan and household income with householder between the ages 25 and 44 in the United States with a correlation coefficient (R) of -0.020 and weighted average of $106,129, a difference of 2.3%.
Householder Income Ages 25 - 44 years Correlation Summary
| Measurement | Immigrants from Spain | Immigrants from Pakistan |
| Minimum | $32,176 | $34,000 |
| Maximum | $250,001 | $187,880 |
| Range | $217,825 | $153,880 |
| Mean | $124,125 | $107,614 |
| Median | $111,426 | $107,714 |
| Interquartile 25% (IQ1) | $97,925 | $93,459 |
| Interquartile 75% (IQ3) | $135,552 | $118,512 |
| Interquartile Range (IQR) | $37,627 | $25,052 |
| Standard Deviation (Sample) | $49,117 | $27,793 |
| Standard Deviation (Population) | $48,684 | $27,582 |
Demographics Similar to Immigrants from Spain and Immigrants from Pakistan by Householder Income Ages 25 - 44 years
In terms of householder income ages 25 - 44 years, the demographic groups most similar to Immigrants from Spain are Korean ($103,824, a difference of 0.070%), Immigrants from Fiji ($103,954, a difference of 0.19%), Italian ($104,215, a difference of 0.45%), Chinese ($104,264, a difference of 0.49%), and Afghan ($104,410, a difference of 0.63%). Similarly, the demographic groups most similar to Immigrants from Pakistan are Immigrants from Austria ($106,103, a difference of 0.030%), Immigrants from South Africa ($105,748, a difference of 0.36%), Immigrants from Latvia ($105,522, a difference of 0.58%), Egyptian ($105,282, a difference of 0.80%), and Lithuanian ($105,223, a difference of 0.86%).
| Demographics | Rating | Rank | Householder Income Ages 25 - 44 years |
| Immigrants | Pakistan | 99.8 /100 | #56 | Exceptional $106,129 |
| Immigrants | Austria | 99.8 /100 | #57 | Exceptional $106,103 |
| Immigrants | South Africa | 99.8 /100 | #58 | Exceptional $105,748 |
| Immigrants | Latvia | 99.8 /100 | #59 | Exceptional $105,522 |
| Egyptians | 99.7 /100 | #60 | Exceptional $105,282 |
| Lithuanians | 99.7 /100 | #61 | Exceptional $105,223 |
| Immigrants | Italy | 99.7 /100 | #62 | Exceptional $105,201 |
| Immigrants | Scotland | 99.7 /100 | #63 | Exceptional $105,089 |
| New Zealanders | 99.7 /100 | #64 | Exceptional $105,085 |
| Immigrants | Netherlands | 99.7 /100 | #65 | Exceptional $105,082 |
| Laotians | 99.7 /100 | #66 | Exceptional $104,993 |
| Immigrants | Romania | 99.6 /100 | #67 | Exceptional $104,713 |
| Immigrants | Eastern Europe | 99.6 /100 | #68 | Exceptional $104,662 |
| Mongolians | 99.6 /100 | #69 | Exceptional $104,578 |
| Immigrants | Croatia | 99.6 /100 | #70 | Exceptional $104,503 |
| Afghans | 99.6 /100 | #71 | Exceptional $104,410 |
| Chinese | 99.5 /100 | #72 | Exceptional $104,264 |
| Italians | 99.5 /100 | #73 | Exceptional $104,215 |
| Immigrants | Fiji | 99.5 /100 | #74 | Exceptional $103,954 |
| Koreans | 99.4 /100 | #75 | Exceptional $103,824 |
| Immigrants | Spain | 99.4 /100 | #76 | Exceptional $103,752 |