Laotian vs Immigrants from Cambodia Householder Income Ages 25 - 44 years
COMPARE
Laotian
Immigrants from Cambodia
Householder Income Ages 25 - 44 years
Householder Income Ages 25 - 44 years Comparison
Laotians
Immigrants from Cambodia
$104,993
HOUSEHOLDER INCOME AGES 25 - 44 YEARS
99.7/ 100
METRIC RATING
66th/ 347
METRIC RANK
$91,533
HOUSEHOLDER INCOME AGES 25 - 44 YEARS
15.7/ 100
METRIC RATING
203rd/ 347
METRIC RANK
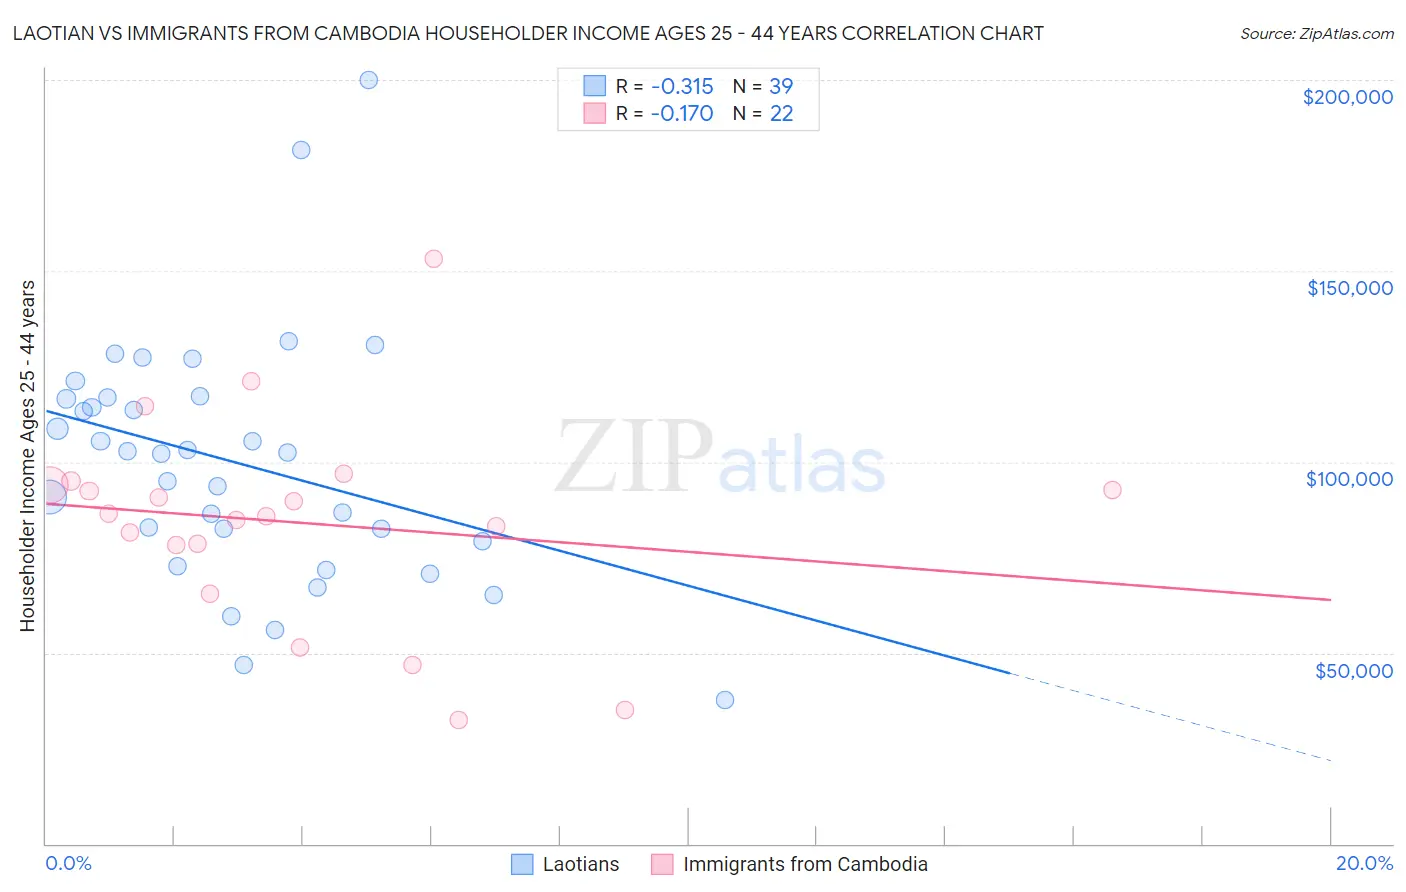
Laotian vs Immigrants from Cambodia Householder Income Ages 25 - 44 years Correlation Chart
The statistical analysis conducted on geographies consisting of 224,507,973 people shows a mild negative correlation between the proportion of Laotians and household income with householder between the ages 25 and 44 in the United States with a correlation coefficient (R) of -0.315 and weighted average of $104,993. Similarly, the statistical analysis conducted on geographies consisting of 205,045,995 people shows a poor negative correlation between the proportion of Immigrants from Cambodia and household income with householder between the ages 25 and 44 in the United States with a correlation coefficient (R) of -0.170 and weighted average of $91,533, a difference of 14.7%.
Householder Income Ages 25 - 44 years Correlation Summary
| Measurement | Laotian | Immigrants from Cambodia |
| Minimum | $37,722 | $32,434 |
| Maximum | $199,931 | $153,083 |
| Range | $162,209 | $120,649 |
| Mean | $99,903 | $84,078 |
| Median | $102,522 | $86,079 |
| Interquartile 25% (IQ1) | $79,125 | $78,256 |
| Interquartile 75% (IQ3) | $116,790 | $93,913 |
| Interquartile Range (IQR) | $37,665 | $15,657 |
| Standard Deviation (Sample) | $32,336 | $27,275 |
| Standard Deviation (Population) | $31,919 | $26,648 |
Similar Demographics by Householder Income Ages 25 - 44 years
Demographics Similar to Laotians by Householder Income Ages 25 - 44 years
In terms of householder income ages 25 - 44 years, the demographic groups most similar to Laotians are Immigrants from Netherlands ($105,082, a difference of 0.080%), Immigrants from Scotland ($105,089, a difference of 0.090%), New Zealander ($105,085, a difference of 0.090%), Immigrants from Italy ($105,201, a difference of 0.20%), and Lithuanian ($105,223, a difference of 0.22%).
| Demographics | Rating | Rank | Householder Income Ages 25 - 44 years |
| Immigrants | Latvia | 99.8 /100 | #59 | Exceptional $105,522 |
| Egyptians | 99.7 /100 | #60 | Exceptional $105,282 |
| Lithuanians | 99.7 /100 | #61 | Exceptional $105,223 |
| Immigrants | Italy | 99.7 /100 | #62 | Exceptional $105,201 |
| Immigrants | Scotland | 99.7 /100 | #63 | Exceptional $105,089 |
| New Zealanders | 99.7 /100 | #64 | Exceptional $105,085 |
| Immigrants | Netherlands | 99.7 /100 | #65 | Exceptional $105,082 |
| Laotians | 99.7 /100 | #66 | Exceptional $104,993 |
| Immigrants | Romania | 99.6 /100 | #67 | Exceptional $104,713 |
| Immigrants | Eastern Europe | 99.6 /100 | #68 | Exceptional $104,662 |
| Mongolians | 99.6 /100 | #69 | Exceptional $104,578 |
| Immigrants | Croatia | 99.6 /100 | #70 | Exceptional $104,503 |
| Afghans | 99.6 /100 | #71 | Exceptional $104,410 |
| Chinese | 99.5 /100 | #72 | Exceptional $104,264 |
| Italians | 99.5 /100 | #73 | Exceptional $104,215 |
Demographics Similar to Immigrants from Cambodia by Householder Income Ages 25 - 44 years
In terms of householder income ages 25 - 44 years, the demographic groups most similar to Immigrants from Cambodia are Ecuadorian ($91,574, a difference of 0.040%), Nepalese ($91,498, a difference of 0.040%), Immigrants from Eastern Africa ($91,458, a difference of 0.080%), Japanese ($91,624, a difference of 0.10%), and White/Caucasian ($91,668, a difference of 0.15%).
| Demographics | Rating | Rank | Householder Income Ages 25 - 44 years |
| Immigrants | Colombia | 21.3 /100 | #196 | Fair $92,204 |
| Spanish | 21.2 /100 | #197 | Fair $92,200 |
| Vietnamese | 20.2 /100 | #198 | Fair $92,089 |
| Kenyans | 16.8 /100 | #199 | Poor $91,684 |
| Whites/Caucasians | 16.7 /100 | #200 | Poor $91,668 |
| Japanese | 16.4 /100 | #201 | Poor $91,624 |
| Ecuadorians | 16.0 /100 | #202 | Poor $91,574 |
| Immigrants | Cambodia | 15.7 /100 | #203 | Poor $91,533 |
| Nepalese | 15.4 /100 | #204 | Poor $91,498 |
| Immigrants | Eastern Africa | 15.2 /100 | #205 | Poor $91,458 |
| Aleuts | 14.5 /100 | #206 | Poor $91,370 |
| Yugoslavians | 14.5 /100 | #207 | Poor $91,368 |
| Immigrants | Thailand | 14.3 /100 | #208 | Poor $91,337 |
| Immigrants | Uruguay | 13.2 /100 | #209 | Poor $91,171 |
| Immigrants | Kenya | 10.9 /100 | #210 | Poor $90,767 |