Liberian vs Immigrants from Cambodia Householder Income Ages 25 - 44 years
COMPARE
Liberian
Immigrants from Cambodia
Householder Income Ages 25 - 44 years
Householder Income Ages 25 - 44 years Comparison
Liberians
Immigrants from Cambodia
$82,005
HOUSEHOLDER INCOME AGES 25 - 44 YEARS
0.1/ 100
METRIC RATING
290th/ 347
METRIC RANK
$91,533
HOUSEHOLDER INCOME AGES 25 - 44 YEARS
15.7/ 100
METRIC RATING
203rd/ 347
METRIC RANK
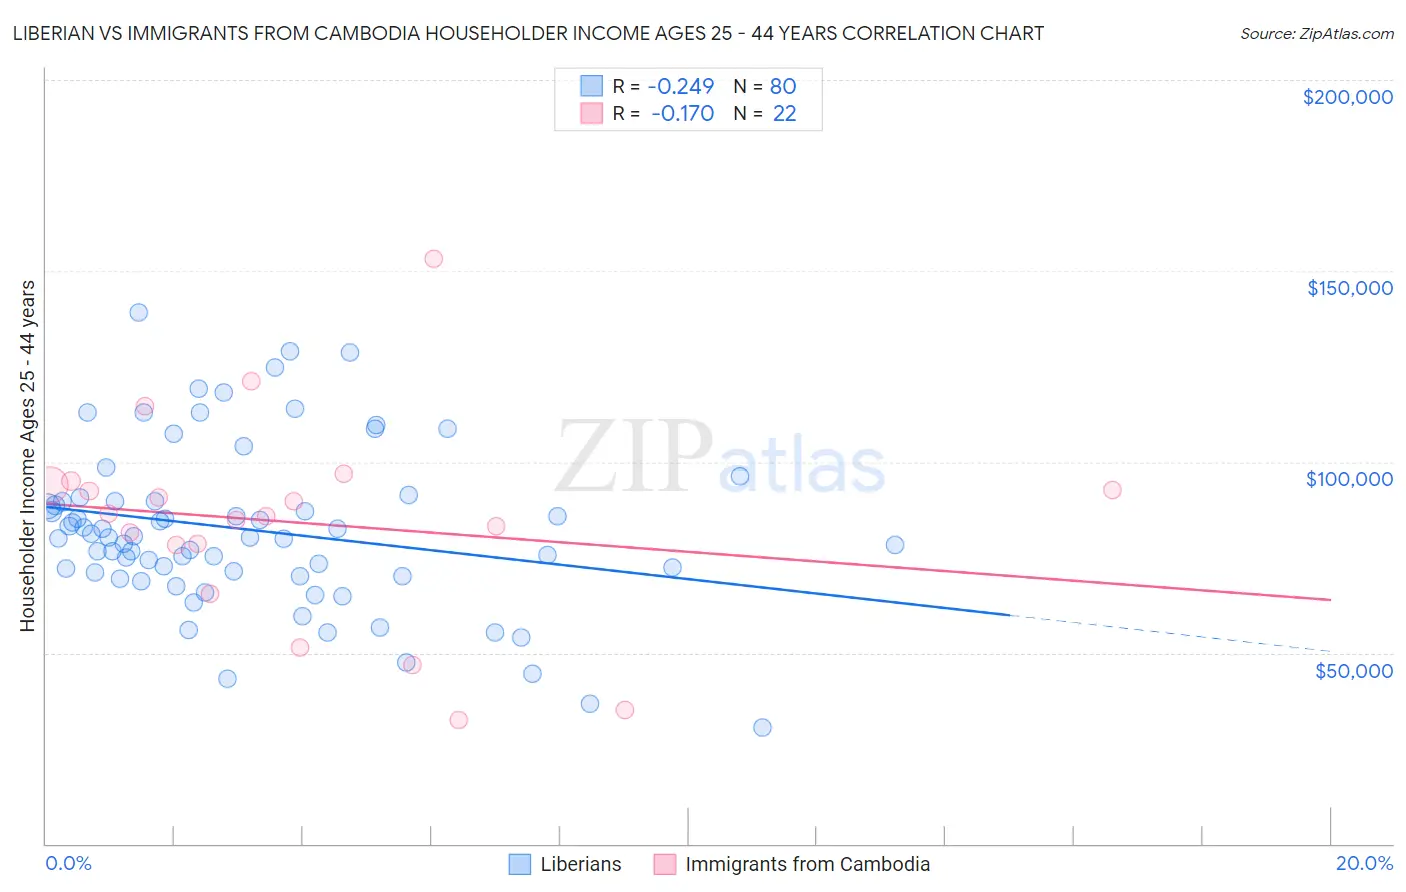
Liberian vs Immigrants from Cambodia Householder Income Ages 25 - 44 years Correlation Chart
The statistical analysis conducted on geographies consisting of 117,996,712 people shows a weak negative correlation between the proportion of Liberians and household income with householder between the ages 25 and 44 in the United States with a correlation coefficient (R) of -0.249 and weighted average of $82,005. Similarly, the statistical analysis conducted on geographies consisting of 205,045,995 people shows a poor negative correlation between the proportion of Immigrants from Cambodia and household income with householder between the ages 25 and 44 in the United States with a correlation coefficient (R) of -0.170 and weighted average of $91,533, a difference of 11.6%.
Householder Income Ages 25 - 44 years Correlation Summary
| Measurement | Liberian | Immigrants from Cambodia |
| Minimum | $30,517 | $32,434 |
| Maximum | $139,167 | $153,083 |
| Range | $108,650 | $120,649 |
| Mean | $82,112 | $84,078 |
| Median | $80,107 | $86,079 |
| Interquartile 25% (IQ1) | $70,490 | $78,256 |
| Interquartile 75% (IQ3) | $89,678 | $93,913 |
| Interquartile Range (IQR) | $19,188 | $15,657 |
| Standard Deviation (Sample) | $21,404 | $27,275 |
| Standard Deviation (Population) | $21,270 | $26,648 |
Similar Demographics by Householder Income Ages 25 - 44 years
Demographics Similar to Liberians by Householder Income Ages 25 - 44 years
In terms of householder income ages 25 - 44 years, the demographic groups most similar to Liberians are Shoshone ($82,062, a difference of 0.070%), Comanche ($82,152, a difference of 0.18%), Ute ($82,166, a difference of 0.20%), Immigrants from Latin America ($82,166, a difference of 0.20%), and Immigrants from Somalia ($82,188, a difference of 0.22%).
| Demographics | Rating | Rank | Householder Income Ages 25 - 44 years |
| Guatemalans | 0.1 /100 | #283 | Tragic $82,331 |
| Immigrants | Middle Africa | 0.1 /100 | #284 | Tragic $82,254 |
| Immigrants | Somalia | 0.1 /100 | #285 | Tragic $82,188 |
| Ute | 0.1 /100 | #286 | Tragic $82,166 |
| Immigrants | Latin America | 0.1 /100 | #287 | Tragic $82,166 |
| Comanche | 0.1 /100 | #288 | Tragic $82,152 |
| Shoshone | 0.1 /100 | #289 | Tragic $82,062 |
| Liberians | 0.1 /100 | #290 | Tragic $82,005 |
| Potawatomi | 0.1 /100 | #291 | Tragic $81,774 |
| Yaqui | 0.1 /100 | #292 | Tragic $81,656 |
| Blackfeet | 0.1 /100 | #293 | Tragic $81,531 |
| Cubans | 0.1 /100 | #294 | Tragic $81,483 |
| Bangladeshis | 0.1 /100 | #295 | Tragic $81,363 |
| Immigrants | Dominica | 0.1 /100 | #296 | Tragic $81,351 |
| Immigrants | Guatemala | 0.1 /100 | #297 | Tragic $81,341 |
Demographics Similar to Immigrants from Cambodia by Householder Income Ages 25 - 44 years
In terms of householder income ages 25 - 44 years, the demographic groups most similar to Immigrants from Cambodia are Ecuadorian ($91,574, a difference of 0.040%), Nepalese ($91,498, a difference of 0.040%), Immigrants from Eastern Africa ($91,458, a difference of 0.080%), Japanese ($91,624, a difference of 0.10%), and White/Caucasian ($91,668, a difference of 0.15%).
| Demographics | Rating | Rank | Householder Income Ages 25 - 44 years |
| Immigrants | Colombia | 21.3 /100 | #196 | Fair $92,204 |
| Spanish | 21.2 /100 | #197 | Fair $92,200 |
| Vietnamese | 20.2 /100 | #198 | Fair $92,089 |
| Kenyans | 16.8 /100 | #199 | Poor $91,684 |
| Whites/Caucasians | 16.7 /100 | #200 | Poor $91,668 |
| Japanese | 16.4 /100 | #201 | Poor $91,624 |
| Ecuadorians | 16.0 /100 | #202 | Poor $91,574 |
| Immigrants | Cambodia | 15.7 /100 | #203 | Poor $91,533 |
| Nepalese | 15.4 /100 | #204 | Poor $91,498 |
| Immigrants | Eastern Africa | 15.2 /100 | #205 | Poor $91,458 |
| Aleuts | 14.5 /100 | #206 | Poor $91,370 |
| Yugoslavians | 14.5 /100 | #207 | Poor $91,368 |
| Immigrants | Thailand | 14.3 /100 | #208 | Poor $91,337 |
| Immigrants | Uruguay | 13.2 /100 | #209 | Poor $91,171 |
| Immigrants | Kenya | 10.9 /100 | #210 | Poor $90,767 |