Immigrants from Spain vs Immigrants from Yemen Householder Income Ages 25 - 44 years
COMPARE
Immigrants from Spain
Immigrants from Yemen
Householder Income Ages 25 - 44 years
Householder Income Ages 25 - 44 years Comparison
Immigrants from Spain
Immigrants from Yemen
$103,752
HOUSEHOLDER INCOME AGES 25 - 44 YEARS
99.4/ 100
METRIC RATING
76th/ 347
METRIC RANK
$73,043
HOUSEHOLDER INCOME AGES 25 - 44 YEARS
0.0/ 100
METRIC RATING
338th/ 347
METRIC RANK
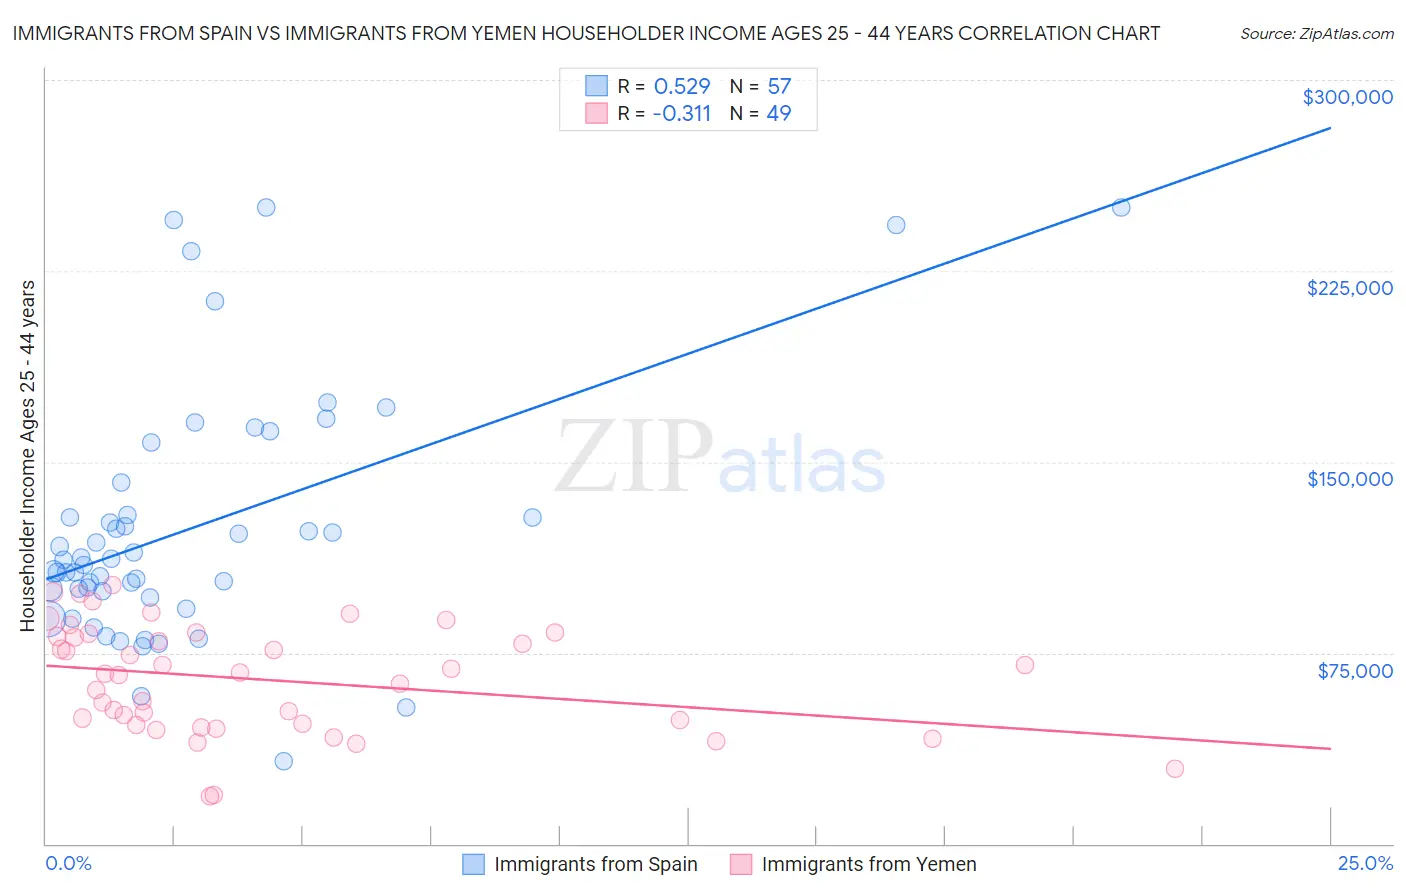
Immigrants from Spain vs Immigrants from Yemen Householder Income Ages 25 - 44 years Correlation Chart
The statistical analysis conducted on geographies consisting of 239,393,463 people shows a substantial positive correlation between the proportion of Immigrants from Spain and household income with householder between the ages 25 and 44 in the United States with a correlation coefficient (R) of 0.529 and weighted average of $103,752. Similarly, the statistical analysis conducted on geographies consisting of 82,403,741 people shows a mild negative correlation between the proportion of Immigrants from Yemen and household income with householder between the ages 25 and 44 in the United States with a correlation coefficient (R) of -0.311 and weighted average of $73,043, a difference of 42.0%.
Householder Income Ages 25 - 44 years Correlation Summary
| Measurement | Immigrants from Spain | Immigrants from Yemen |
| Minimum | $32,176 | $18,875 |
| Maximum | $250,001 | $101,667 |
| Range | $217,825 | $82,792 |
| Mean | $124,125 | $64,384 |
| Median | $111,426 | $66,841 |
| Interquartile 25% (IQ1) | $97,925 | $46,776 |
| Interquartile 75% (IQ3) | $135,552 | $82,060 |
| Interquartile Range (IQR) | $37,627 | $35,284 |
| Standard Deviation (Sample) | $49,117 | $21,181 |
| Standard Deviation (Population) | $48,684 | $20,964 |
Similar Demographics by Householder Income Ages 25 - 44 years
Demographics Similar to Immigrants from Spain by Householder Income Ages 25 - 44 years
In terms of householder income ages 25 - 44 years, the demographic groups most similar to Immigrants from Spain are Korean ($103,824, a difference of 0.070%), Immigrants from Fiji ($103,954, a difference of 0.19%), Immigrants from Southern Europe ($103,486, a difference of 0.26%), Immigrants from Bulgaria ($103,423, a difference of 0.32%), and Italian ($104,215, a difference of 0.45%).
| Demographics | Rating | Rank | Householder Income Ages 25 - 44 years |
| Mongolians | 99.6 /100 | #69 | Exceptional $104,578 |
| Immigrants | Croatia | 99.6 /100 | #70 | Exceptional $104,503 |
| Afghans | 99.6 /100 | #71 | Exceptional $104,410 |
| Chinese | 99.5 /100 | #72 | Exceptional $104,264 |
| Italians | 99.5 /100 | #73 | Exceptional $104,215 |
| Immigrants | Fiji | 99.5 /100 | #74 | Exceptional $103,954 |
| Koreans | 99.4 /100 | #75 | Exceptional $103,824 |
| Immigrants | Spain | 99.4 /100 | #76 | Exceptional $103,752 |
| Immigrants | Southern Europe | 99.3 /100 | #77 | Exceptional $103,486 |
| Immigrants | Bulgaria | 99.3 /100 | #78 | Exceptional $103,423 |
| Armenians | 99.2 /100 | #79 | Exceptional $103,248 |
| Immigrants | Egypt | 99.2 /100 | #80 | Exceptional $103,192 |
| South Africans | 99.2 /100 | #81 | Exceptional $103,160 |
| Immigrants | Serbia | 99.2 /100 | #82 | Exceptional $103,155 |
| Argentineans | 99.1 /100 | #83 | Exceptional $103,111 |
Demographics Similar to Immigrants from Yemen by Householder Income Ages 25 - 44 years
In terms of householder income ages 25 - 44 years, the demographic groups most similar to Immigrants from Yemen are Yuman ($72,956, a difference of 0.12%), Black/African American ($73,370, a difference of 0.45%), Yup'ik ($73,688, a difference of 0.88%), Immigrants from Congo ($72,178, a difference of 1.2%), and Arapaho ($71,697, a difference of 1.9%).
| Demographics | Rating | Rank | Householder Income Ages 25 - 44 years |
| Natives/Alaskans | 0.0 /100 | #331 | Tragic $75,647 |
| Bahamians | 0.0 /100 | #332 | Tragic $75,395 |
| Hopi | 0.0 /100 | #333 | Tragic $75,002 |
| Creek | 0.0 /100 | #334 | Tragic $74,847 |
| Kiowa | 0.0 /100 | #335 | Tragic $74,776 |
| Yup'ik | 0.0 /100 | #336 | Tragic $73,688 |
| Blacks/African Americans | 0.0 /100 | #337 | Tragic $73,370 |
| Immigrants | Yemen | 0.0 /100 | #338 | Tragic $73,043 |
| Yuman | 0.0 /100 | #339 | Tragic $72,956 |
| Immigrants | Congo | 0.0 /100 | #340 | Tragic $72,178 |
| Arapaho | 0.0 /100 | #341 | Tragic $71,697 |
| Crow | 0.0 /100 | #342 | Tragic $71,337 |
| Tohono O'odham | 0.0 /100 | #343 | Tragic $69,068 |
| Pueblo | 0.0 /100 | #344 | Tragic $68,910 |
| Navajo | 0.0 /100 | #345 | Tragic $66,529 |