Immigrants from Australia vs Immigrants from Cambodia Householder Income Ages 25 - 44 years
COMPARE
Immigrants from Australia
Immigrants from Cambodia
Householder Income Ages 25 - 44 years
Householder Income Ages 25 - 44 years Comparison
Immigrants from Australia
Immigrants from Cambodia
$115,947
HOUSEHOLDER INCOME AGES 25 - 44 YEARS
100.0/ 100
METRIC RATING
17th/ 347
METRIC RANK
$91,533
HOUSEHOLDER INCOME AGES 25 - 44 YEARS
15.7/ 100
METRIC RATING
203rd/ 347
METRIC RANK
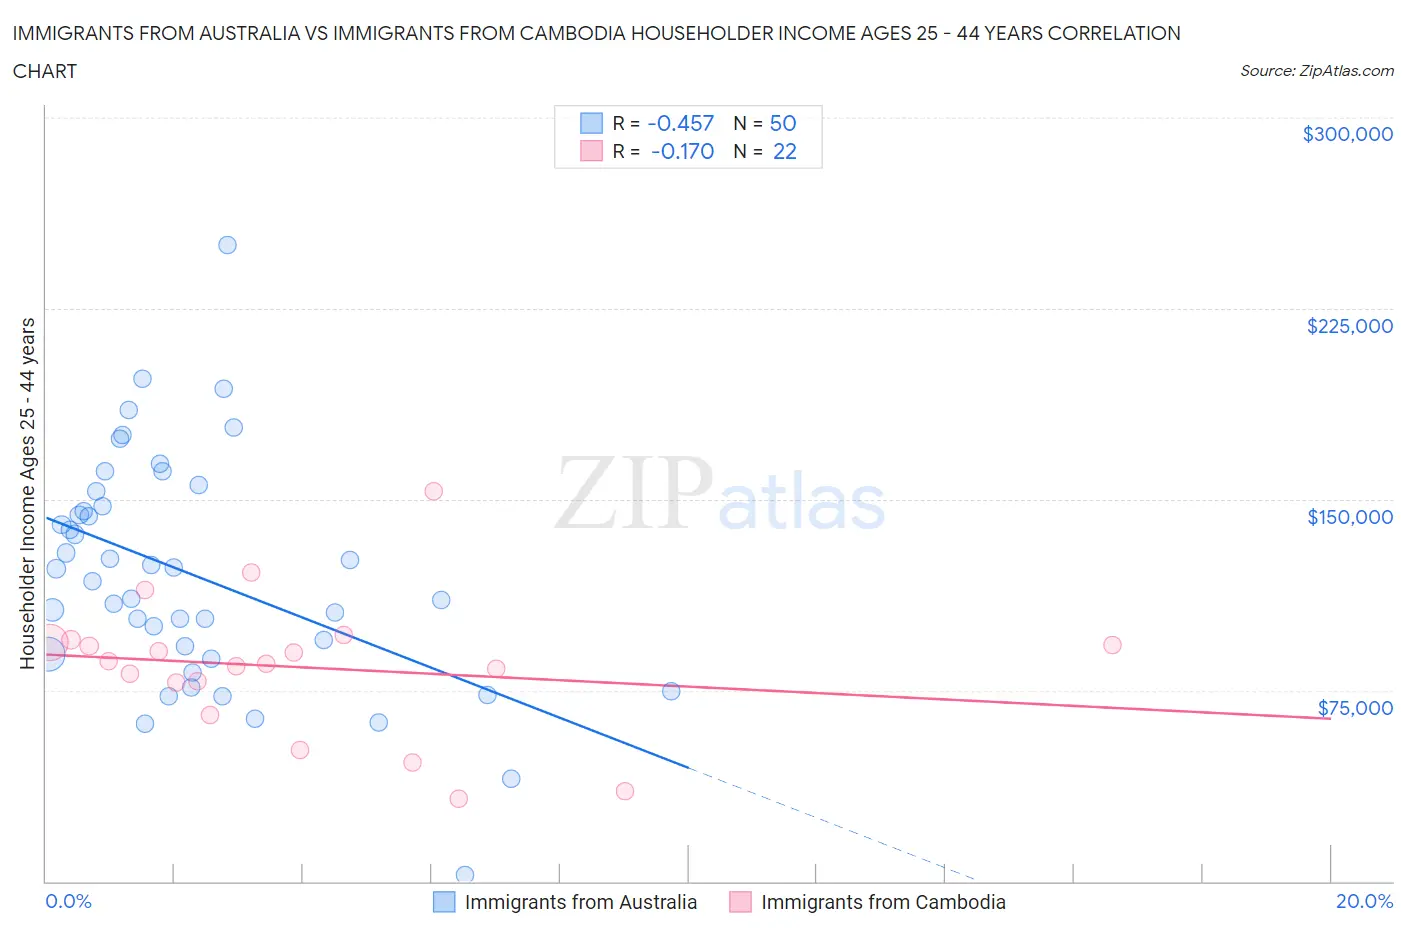
Immigrants from Australia vs Immigrants from Cambodia Householder Income Ages 25 - 44 years Correlation Chart
The statistical analysis conducted on geographies consisting of 226,902,734 people shows a moderate negative correlation between the proportion of Immigrants from Australia and household income with householder between the ages 25 and 44 in the United States with a correlation coefficient (R) of -0.457 and weighted average of $115,947. Similarly, the statistical analysis conducted on geographies consisting of 205,045,995 people shows a poor negative correlation between the proportion of Immigrants from Cambodia and household income with householder between the ages 25 and 44 in the United States with a correlation coefficient (R) of -0.170 and weighted average of $91,533, a difference of 26.7%.
Householder Income Ages 25 - 44 years Correlation Summary
| Measurement | Immigrants from Australia | Immigrants from Cambodia |
| Minimum | $2,499 | $32,434 |
| Maximum | $250,001 | $153,083 |
| Range | $247,502 | $120,649 |
| Mean | $120,207 | $84,078 |
| Median | $120,330 | $86,079 |
| Interquartile 25% (IQ1) | $89,211 | $78,256 |
| Interquartile 75% (IQ3) | $147,110 | $93,913 |
| Interquartile Range (IQR) | $57,899 | $15,657 |
| Standard Deviation (Sample) | $45,319 | $27,275 |
| Standard Deviation (Population) | $44,864 | $26,648 |
Similar Demographics by Householder Income Ages 25 - 44 years
Demographics Similar to Immigrants from Australia by Householder Income Ages 25 - 44 years
In terms of householder income ages 25 - 44 years, the demographic groups most similar to Immigrants from Australia are Cypriot ($116,364, a difference of 0.36%), Immigrants from South Central Asia ($116,626, a difference of 0.59%), Immigrants from Israel ($117,219, a difference of 1.1%), Eastern European ($114,523, a difference of 1.2%), and Immigrants from Eastern Asia ($118,056, a difference of 1.8%).
| Demographics | Rating | Rank | Householder Income Ages 25 - 44 years |
| Indians (Asian) | 100.0 /100 | #10 | Exceptional $119,496 |
| Okinawans | 100.0 /100 | #11 | Exceptional $119,349 |
| Immigrants | Iran | 100.0 /100 | #12 | Exceptional $119,204 |
| Immigrants | Eastern Asia | 100.0 /100 | #13 | Exceptional $118,056 |
| Immigrants | Israel | 100.0 /100 | #14 | Exceptional $117,219 |
| Immigrants | South Central Asia | 100.0 /100 | #15 | Exceptional $116,626 |
| Cypriots | 100.0 /100 | #16 | Exceptional $116,364 |
| Immigrants | Australia | 100.0 /100 | #17 | Exceptional $115,947 |
| Eastern Europeans | 100.0 /100 | #18 | Exceptional $114,523 |
| Burmese | 100.0 /100 | #19 | Exceptional $113,701 |
| Immigrants | Korea | 100.0 /100 | #20 | Exceptional $113,401 |
| Asians | 100.0 /100 | #21 | Exceptional $112,666 |
| Immigrants | Belgium | 100.0 /100 | #22 | Exceptional $112,575 |
| Immigrants | Japan | 100.0 /100 | #23 | Exceptional $112,228 |
| Immigrants | Sweden | 100.0 /100 | #24 | Exceptional $112,010 |
Demographics Similar to Immigrants from Cambodia by Householder Income Ages 25 - 44 years
In terms of householder income ages 25 - 44 years, the demographic groups most similar to Immigrants from Cambodia are Ecuadorian ($91,574, a difference of 0.040%), Nepalese ($91,498, a difference of 0.040%), Immigrants from Eastern Africa ($91,458, a difference of 0.080%), Japanese ($91,624, a difference of 0.10%), and White/Caucasian ($91,668, a difference of 0.15%).
| Demographics | Rating | Rank | Householder Income Ages 25 - 44 years |
| Immigrants | Colombia | 21.3 /100 | #196 | Fair $92,204 |
| Spanish | 21.2 /100 | #197 | Fair $92,200 |
| Vietnamese | 20.2 /100 | #198 | Fair $92,089 |
| Kenyans | 16.8 /100 | #199 | Poor $91,684 |
| Whites/Caucasians | 16.7 /100 | #200 | Poor $91,668 |
| Japanese | 16.4 /100 | #201 | Poor $91,624 |
| Ecuadorians | 16.0 /100 | #202 | Poor $91,574 |
| Immigrants | Cambodia | 15.7 /100 | #203 | Poor $91,533 |
| Nepalese | 15.4 /100 | #204 | Poor $91,498 |
| Immigrants | Eastern Africa | 15.2 /100 | #205 | Poor $91,458 |
| Aleuts | 14.5 /100 | #206 | Poor $91,370 |
| Yugoslavians | 14.5 /100 | #207 | Poor $91,368 |
| Immigrants | Thailand | 14.3 /100 | #208 | Poor $91,337 |
| Immigrants | Uruguay | 13.2 /100 | #209 | Poor $91,171 |
| Immigrants | Kenya | 10.9 /100 | #210 | Poor $90,767 |