Immigrants from Spain vs Immigrants from Jordan Householder Income Ages 25 - 44 years
COMPARE
Immigrants from Spain
Immigrants from Jordan
Householder Income Ages 25 - 44 years
Householder Income Ages 25 - 44 years Comparison
Immigrants from Spain
Immigrants from Jordan
$103,752
HOUSEHOLDER INCOME AGES 25 - 44 YEARS
99.4/ 100
METRIC RATING
76th/ 347
METRIC RANK
$97,185
HOUSEHOLDER INCOME AGES 25 - 44 YEARS
81.0/ 100
METRIC RATING
143rd/ 347
METRIC RANK
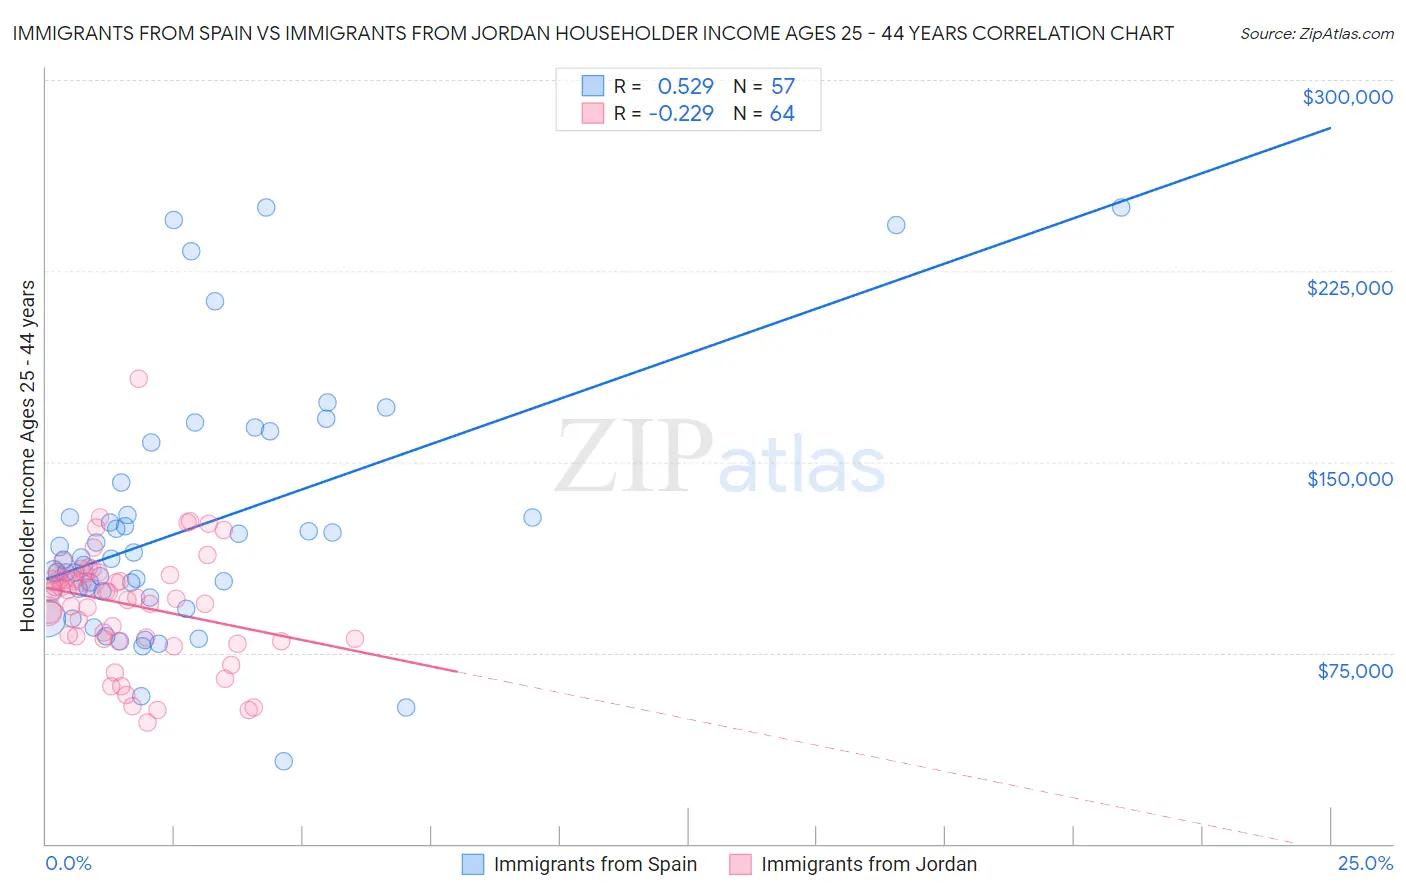
Immigrants from Spain vs Immigrants from Jordan Householder Income Ages 25 - 44 years Correlation Chart
The statistical analysis conducted on geographies consisting of 239,393,463 people shows a substantial positive correlation between the proportion of Immigrants from Spain and household income with householder between the ages 25 and 44 in the United States with a correlation coefficient (R) of 0.529 and weighted average of $103,752. Similarly, the statistical analysis conducted on geographies consisting of 181,164,204 people shows a weak negative correlation between the proportion of Immigrants from Jordan and household income with householder between the ages 25 and 44 in the United States with a correlation coefficient (R) of -0.229 and weighted average of $97,185, a difference of 6.8%.
Householder Income Ages 25 - 44 years Correlation Summary
| Measurement | Immigrants from Spain | Immigrants from Jordan |
| Minimum | $32,176 | $47,644 |
| Maximum | $250,001 | $182,512 |
| Range | $217,825 | $134,868 |
| Mean | $124,125 | $94,069 |
| Median | $111,426 | $97,769 |
| Interquartile 25% (IQ1) | $97,925 | $80,422 |
| Interquartile 75% (IQ3) | $135,552 | $105,721 |
| Interquartile Range (IQR) | $37,627 | $25,299 |
| Standard Deviation (Sample) | $49,117 | $23,095 |
| Standard Deviation (Population) | $48,684 | $22,914 |
Similar Demographics by Householder Income Ages 25 - 44 years
Demographics Similar to Immigrants from Spain by Householder Income Ages 25 - 44 years
In terms of householder income ages 25 - 44 years, the demographic groups most similar to Immigrants from Spain are Korean ($103,824, a difference of 0.070%), Immigrants from Fiji ($103,954, a difference of 0.19%), Immigrants from Southern Europe ($103,486, a difference of 0.26%), Immigrants from Bulgaria ($103,423, a difference of 0.32%), and Italian ($104,215, a difference of 0.45%).
| Demographics | Rating | Rank | Householder Income Ages 25 - 44 years |
| Mongolians | 99.6 /100 | #69 | Exceptional $104,578 |
| Immigrants | Croatia | 99.6 /100 | #70 | Exceptional $104,503 |
| Afghans | 99.6 /100 | #71 | Exceptional $104,410 |
| Chinese | 99.5 /100 | #72 | Exceptional $104,264 |
| Italians | 99.5 /100 | #73 | Exceptional $104,215 |
| Immigrants | Fiji | 99.5 /100 | #74 | Exceptional $103,954 |
| Koreans | 99.4 /100 | #75 | Exceptional $103,824 |
| Immigrants | Spain | 99.4 /100 | #76 | Exceptional $103,752 |
| Immigrants | Southern Europe | 99.3 /100 | #77 | Exceptional $103,486 |
| Immigrants | Bulgaria | 99.3 /100 | #78 | Exceptional $103,423 |
| Armenians | 99.2 /100 | #79 | Exceptional $103,248 |
| Immigrants | Egypt | 99.2 /100 | #80 | Exceptional $103,192 |
| South Africans | 99.2 /100 | #81 | Exceptional $103,160 |
| Immigrants | Serbia | 99.2 /100 | #82 | Exceptional $103,155 |
| Argentineans | 99.1 /100 | #83 | Exceptional $103,111 |
Demographics Similar to Immigrants from Jordan by Householder Income Ages 25 - 44 years
In terms of householder income ages 25 - 44 years, the demographic groups most similar to Immigrants from Jordan are Immigrants from Chile ($97,159, a difference of 0.030%), Danish ($97,221, a difference of 0.040%), Luxembourger ($97,237, a difference of 0.050%), Immigrants from Morocco ($97,305, a difference of 0.12%), and Immigrants from Peru ($97,329, a difference of 0.15%).
| Demographics | Rating | Rank | Householder Income Ages 25 - 44 years |
| Hungarians | 83.9 /100 | #136 | Excellent $97,544 |
| Lebanese | 82.3 /100 | #137 | Excellent $97,339 |
| Arabs | 82.3 /100 | #138 | Excellent $97,336 |
| Immigrants | Peru | 82.2 /100 | #139 | Excellent $97,329 |
| Immigrants | Morocco | 82.0 /100 | #140 | Excellent $97,305 |
| Luxembourgers | 81.5 /100 | #141 | Excellent $97,237 |
| Danes | 81.3 /100 | #142 | Excellent $97,221 |
| Immigrants | Jordan | 81.0 /100 | #143 | Excellent $97,185 |
| Immigrants | Chile | 80.8 /100 | #144 | Excellent $97,159 |
| Norwegians | 78.2 /100 | #145 | Good $96,866 |
| Ethiopians | 77.8 /100 | #146 | Good $96,824 |
| Immigrants | Syria | 77.4 /100 | #147 | Good $96,789 |
| Irish | 76.9 /100 | #148 | Good $96,730 |
| Basques | 76.6 /100 | #149 | Good $96,709 |
| Ugandans | 76.2 /100 | #150 | Good $96,667 |