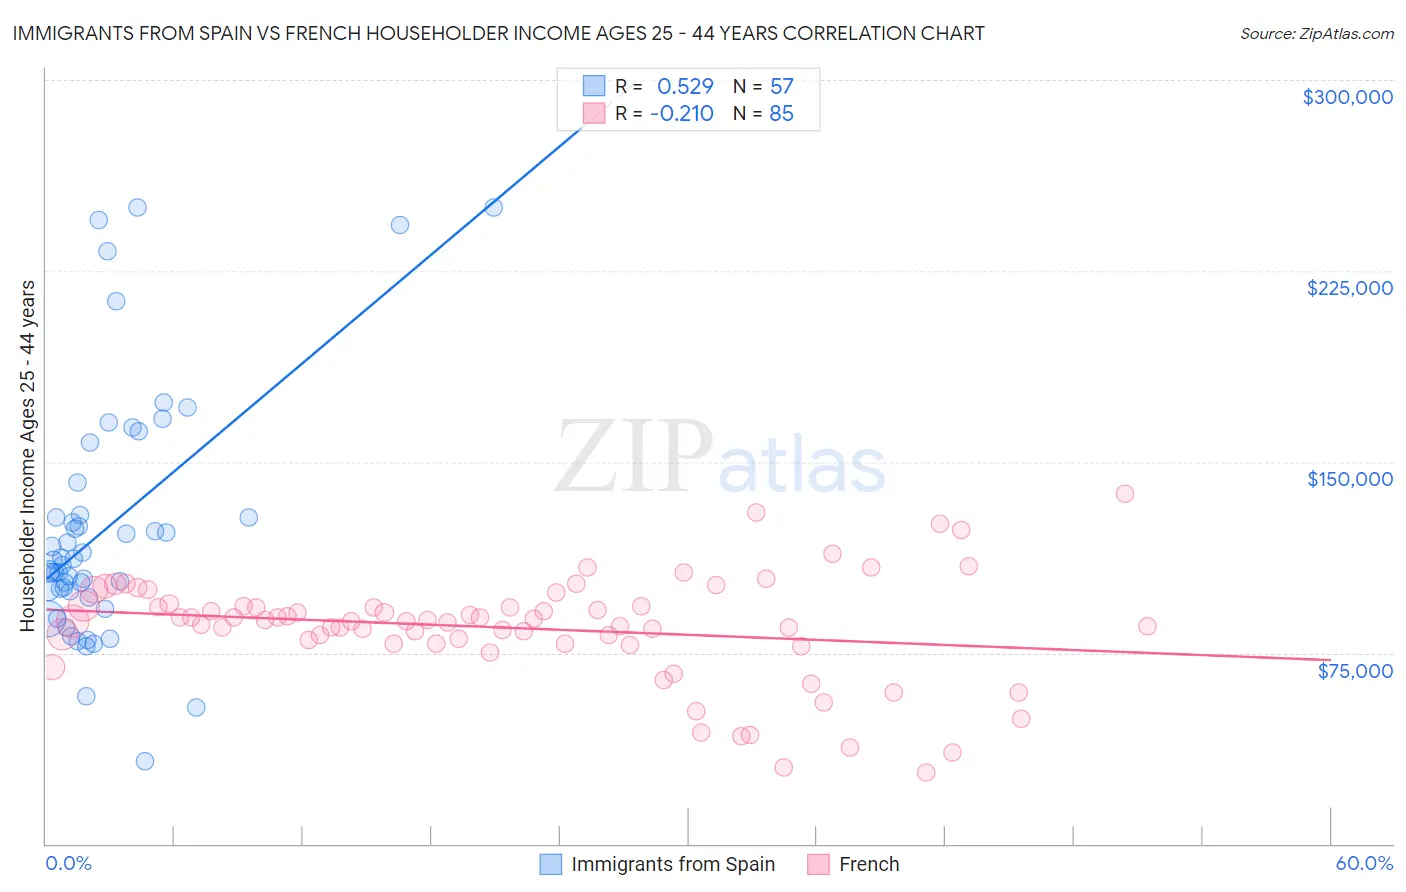
Immigrants from Spain vs French Householder Income Ages 25 - 44 years
COMPARE
Immigrants from Spain
French
Householder Income Ages 25 - 44 years
Householder Income Ages 25 - 44 years Comparison
Immigrants from Spain
French
$103,752
HOUSEHOLDER INCOME AGES 25 - 44 YEARS
99.4/ 100
METRIC RATING
76th/ 347
METRIC RANK
$93,665
HOUSEHOLDER INCOME AGES 25 - 44 YEARS
37.8/ 100
METRIC RATING
180th/ 347
METRIC RANK
Immigrants from Spain vs French Householder Income Ages 25 - 44 years Correlation Chart
The statistical analysis conducted on geographies consisting of 239,393,463 people shows a substantial positive correlation between the proportion of Immigrants from Spain and household income with householder between the ages 25 and 44 in the United States with a correlation coefficient (R) of 0.529 and weighted average of $103,752. Similarly, the statistical analysis conducted on geographies consisting of 566,574,602 people shows a weak negative correlation between the proportion of French and household income with householder between the ages 25 and 44 in the United States with a correlation coefficient (R) of -0.210 and weighted average of $93,665, a difference of 10.8%.
Householder Income Ages 25 - 44 years Correlation Summary
| Measurement | Immigrants from Spain | French |
| Minimum | $32,176 | $28,047 |
| Maximum | $250,001 | $137,237 |
| Range | $217,825 | $109,190 |
| Mean | $124,125 | $84,736 |
| Median | $111,426 | $87,325 |
| Interquartile 25% (IQ1) | $97,925 | $78,650 |
| Interquartile 75% (IQ3) | $135,552 | $93,493 |
| Interquartile Range (IQR) | $37,627 | $14,843 |
| Standard Deviation (Sample) | $49,117 | $21,004 |
| Standard Deviation (Population) | $48,684 | $20,880 |
Similar Demographics by Householder Income Ages 25 - 44 years
Demographics Similar to Immigrants from Spain by Householder Income Ages 25 - 44 years
In terms of householder income ages 25 - 44 years, the demographic groups most similar to Immigrants from Spain are Korean ($103,824, a difference of 0.070%), Immigrants from Fiji ($103,954, a difference of 0.19%), Immigrants from Southern Europe ($103,486, a difference of 0.26%), Immigrants from Bulgaria ($103,423, a difference of 0.32%), and Italian ($104,215, a difference of 0.45%).
| Demographics | Rating | Rank | Householder Income Ages 25 - 44 years |
| Mongolians | 99.6 /100 | #69 | Exceptional $104,578 |
| Immigrants | Croatia | 99.6 /100 | #70 | Exceptional $104,503 |
| Afghans | 99.6 /100 | #71 | Exceptional $104,410 |
| Chinese | 99.5 /100 | #72 | Exceptional $104,264 |
| Italians | 99.5 /100 | #73 | Exceptional $104,215 |
| Immigrants | Fiji | 99.5 /100 | #74 | Exceptional $103,954 |
| Koreans | 99.4 /100 | #75 | Exceptional $103,824 |
| Immigrants | Spain | 99.4 /100 | #76 | Exceptional $103,752 |
| Immigrants | Southern Europe | 99.3 /100 | #77 | Exceptional $103,486 |
| Immigrants | Bulgaria | 99.3 /100 | #78 | Exceptional $103,423 |
| Armenians | 99.2 /100 | #79 | Exceptional $103,248 |
| Immigrants | Egypt | 99.2 /100 | #80 | Exceptional $103,192 |
| South Africans | 99.2 /100 | #81 | Exceptional $103,160 |
| Immigrants | Serbia | 99.2 /100 | #82 | Exceptional $103,155 |
| Argentineans | 99.1 /100 | #83 | Exceptional $103,111 |
Demographics Similar to French by Householder Income Ages 25 - 44 years
In terms of householder income ages 25 - 44 years, the demographic groups most similar to French are Puget Sound Salish ($93,661, a difference of 0.0%), French Canadian ($93,694, a difference of 0.030%), Uruguayan ($93,631, a difference of 0.040%), Guamanian/Chamorro ($93,569, a difference of 0.10%), and German ($93,531, a difference of 0.14%).
| Demographics | Rating | Rank | Householder Income Ages 25 - 44 years |
| Finns | 50.6 /100 | #173 | Average $94,610 |
| Colombians | 50.0 /100 | #174 | Average $94,565 |
| English | 48.1 /100 | #175 | Average $94,429 |
| Immigrants | Immigrants | 48.0 /100 | #176 | Average $94,423 |
| Belgians | 45.8 /100 | #177 | Average $94,262 |
| Immigrants | South America | 42.8 /100 | #178 | Average $94,042 |
| French Canadians | 38.2 /100 | #179 | Fair $93,694 |
| French | 37.8 /100 | #180 | Fair $93,665 |
| Puget Sound Salish | 37.7 /100 | #181 | Fair $93,661 |
| Uruguayans | 37.3 /100 | #182 | Fair $93,631 |
| Guamanians/Chamorros | 36.5 /100 | #183 | Fair $93,569 |
| Germans | 36.0 /100 | #184 | Fair $93,531 |
| Immigrants | Eritrea | 35.2 /100 | #185 | Fair $93,466 |
| Sierra Leoneans | 34.8 /100 | #186 | Fair $93,435 |
| Spaniards | 34.0 /100 | #187 | Fair $93,366 |