Immigrants from South Central Asia vs Vietnamese Family Households
COMPARE
Immigrants from South Central Asia
Vietnamese
Family Households
Family Households Comparison
Immigrants from South Central Asia
Vietnamese
66.4%
FAMILY HOUSEHOLDS
100.0/ 100
METRIC RATING
49th/ 347
METRIC RANK
64.2%
FAMILY HOUSEHOLDS
43.6/ 100
METRIC RATING
176th/ 347
METRIC RANK
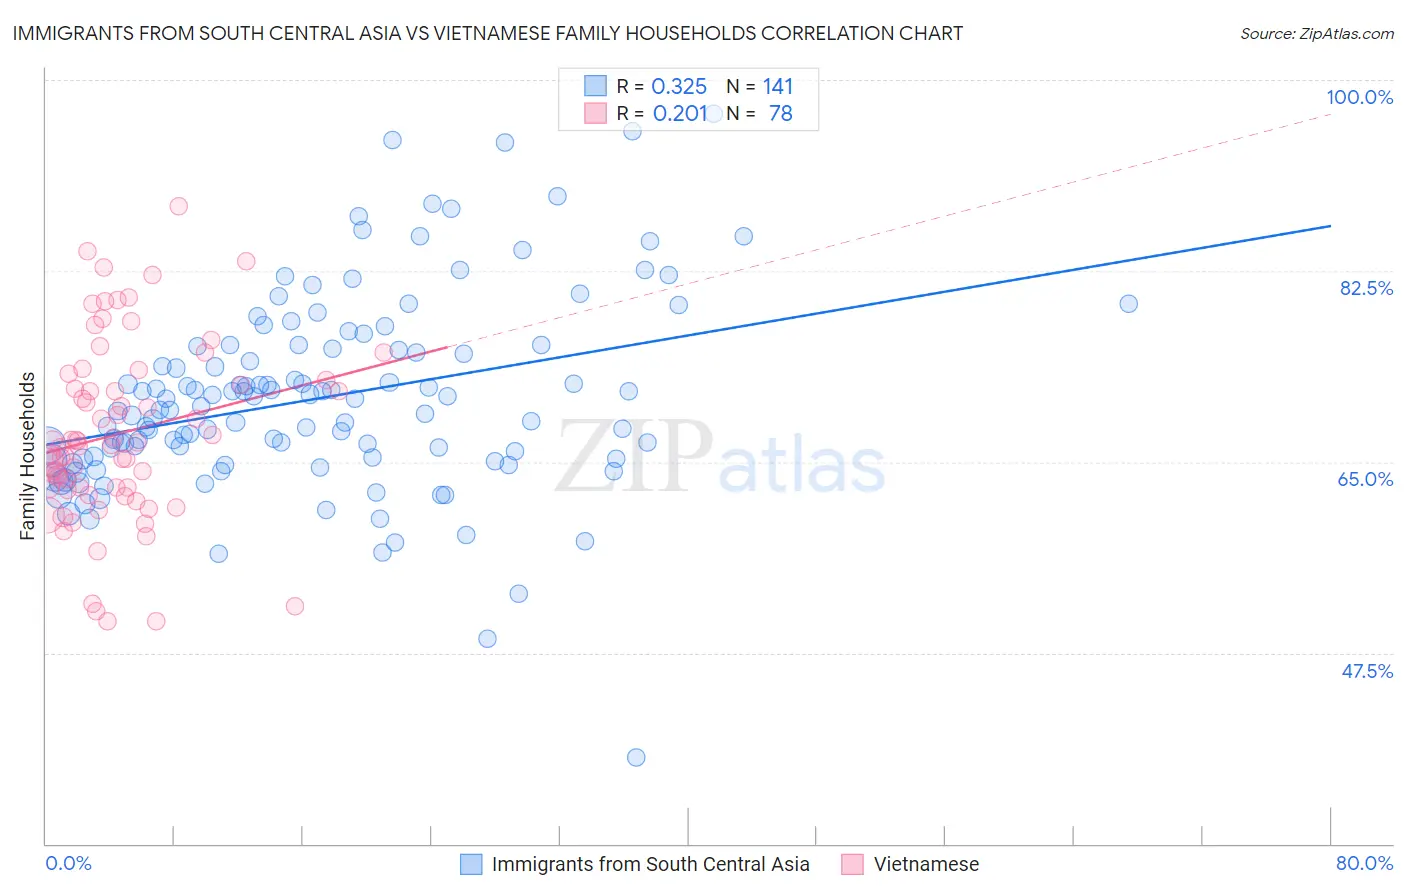
Immigrants from South Central Asia vs Vietnamese Family Households Correlation Chart
The statistical analysis conducted on geographies consisting of 472,677,474 people shows a mild positive correlation between the proportion of Immigrants from South Central Asia and percentage of family households in the United States with a correlation coefficient (R) of 0.325 and weighted average of 66.4%. Similarly, the statistical analysis conducted on geographies consisting of 170,660,607 people shows a weak positive correlation between the proportion of Vietnamese and percentage of family households in the United States with a correlation coefficient (R) of 0.201 and weighted average of 64.2%, a difference of 3.4%.
Family Households Correlation Summary
| Measurement | Immigrants from South Central Asia | Vietnamese |
| Minimum | 37.9% | 50.4% |
| Maximum | 97.0% | 88.4% |
| Range | 59.0% | 38.0% |
| Mean | 70.8% | 67.6% |
| Median | 69.8% | 66.7% |
| Interquartile 25% (IQ1) | 65.3% | 62.6% |
| Interquartile 75% (IQ3) | 75.5% | 72.5% |
| Interquartile Range (IQR) | 10.2% | 9.9% |
| Standard Deviation (Sample) | 9.0% | 8.2% |
| Standard Deviation (Population) | 9.0% | 8.2% |
Similar Demographics by Family Households
Demographics Similar to Immigrants from South Central Asia by Family Households
In terms of family households, the demographic groups most similar to Immigrants from South Central Asia are Immigrants from Venezuela (66.4%, a difference of 0.050%), Bolivian (66.5%, a difference of 0.070%), Navajo (66.4%, a difference of 0.070%), Native/Alaskan (66.4%, a difference of 0.090%), and Arapaho (66.5%, a difference of 0.10%).
| Demographics | Rating | Rank | Family Households |
| Menominee | 100.0 /100 | #42 | Exceptional 66.5% |
| Apache | 100.0 /100 | #43 | Exceptional 66.5% |
| Asians | 100.0 /100 | #44 | Exceptional 66.5% |
| Venezuelans | 100.0 /100 | #45 | Exceptional 66.5% |
| Arapaho | 100.0 /100 | #46 | Exceptional 66.5% |
| Bolivians | 100.0 /100 | #47 | Exceptional 66.5% |
| Immigrants | Venezuela | 100.0 /100 | #48 | Exceptional 66.4% |
| Immigrants | South Central Asia | 100.0 /100 | #49 | Exceptional 66.4% |
| Navajo | 100.0 /100 | #50 | Exceptional 66.4% |
| Natives/Alaskans | 100.0 /100 | #51 | Exceptional 66.4% |
| Colombians | 100.0 /100 | #52 | Exceptional 66.3% |
| Afghans | 100.0 /100 | #53 | Exceptional 66.3% |
| Immigrants | Colombia | 100.0 /100 | #54 | Exceptional 66.3% |
| Immigrants | Immigrants | 100.0 /100 | #55 | Exceptional 66.1% |
| Immigrants | Hong Kong | 100.0 /100 | #56 | Exceptional 66.1% |
Demographics Similar to Vietnamese by Family Households
In terms of family households, the demographic groups most similar to Vietnamese are Bangladeshi (64.3%, a difference of 0.010%), Immigrants from Micronesia (64.2%, a difference of 0.020%), Jamaican (64.2%, a difference of 0.040%), Immigrants from Ukraine (64.2%, a difference of 0.080%), and Immigrants from Germany (64.3%, a difference of 0.090%).
| Demographics | Rating | Rank | Family Households |
| Iraqis | 56.0 /100 | #169 | Average 64.4% |
| Armenians | 55.9 /100 | #170 | Average 64.4% |
| Ute | 54.6 /100 | #171 | Average 64.3% |
| Dutch West Indians | 53.9 /100 | #172 | Average 64.3% |
| Immigrants | Sierra Leone | 52.5 /100 | #173 | Average 64.3% |
| Immigrants | Germany | 50.0 /100 | #174 | Average 64.3% |
| Bangladeshis | 44.3 /100 | #175 | Average 64.3% |
| Vietnamese | 43.6 /100 | #176 | Average 64.2% |
| Immigrants | Micronesia | 42.3 /100 | #177 | Average 64.2% |
| Jamaicans | 40.6 /100 | #178 | Average 64.2% |
| Immigrants | Ukraine | 38.2 /100 | #179 | Fair 64.2% |
| Immigrants | Honduras | 35.0 /100 | #180 | Fair 64.2% |
| Immigrants | Trinidad and Tobago | 34.9 /100 | #181 | Fair 64.2% |
| Ukrainians | 34.6 /100 | #182 | Fair 64.2% |
| Creek | 34.1 /100 | #183 | Fair 64.2% |