Immigrants from South Central Asia vs Immigrants from England Median Earnings
COMPARE
Immigrants from South Central Asia
Immigrants from England
Median Earnings
Median Earnings Comparison
Immigrants from South Central Asia
Immigrants from England
$57,114
MEDIAN EARNINGS
100.0/ 100
METRIC RATING
10th/ 347
METRIC RANK
$49,722
MEDIAN EARNINGS
99.0/ 100
METRIC RATING
95th/ 347
METRIC RANK
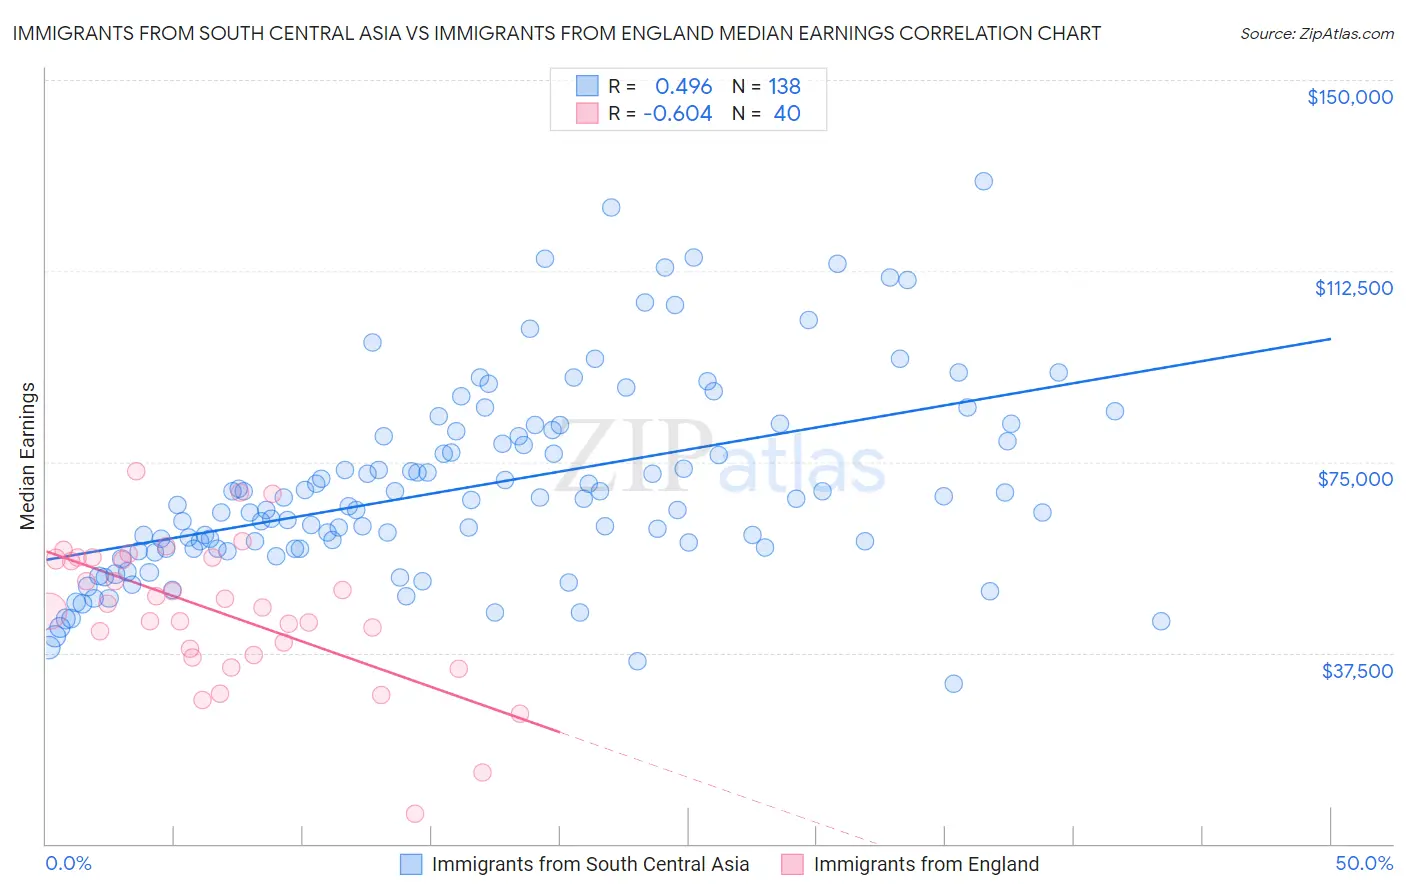
Immigrants from South Central Asia vs Immigrants from England Median Earnings Correlation Chart
The statistical analysis conducted on geographies consisting of 473,088,243 people shows a moderate positive correlation between the proportion of Immigrants from South Central Asia and median earnings in the United States with a correlation coefficient (R) of 0.496 and weighted average of $57,114. Similarly, the statistical analysis conducted on geographies consisting of 391,848,083 people shows a significant negative correlation between the proportion of Immigrants from England and median earnings in the United States with a correlation coefficient (R) of -0.604 and weighted average of $49,722, a difference of 14.9%.
Median Earnings Correlation Summary
| Measurement | Immigrants from South Central Asia | Immigrants from England |
| Minimum | $31,327 | $5,997 |
| Maximum | $130,186 | $73,280 |
| Range | $98,859 | $67,283 |
| Mean | $69,984 | $45,709 |
| Median | $66,961 | $46,726 |
| Interquartile 25% (IQ1) | $57,896 | $37,678 |
| Interquartile 75% (IQ3) | $80,093 | $55,979 |
| Interquartile Range (IQR) | $22,197 | $18,301 |
| Standard Deviation (Sample) | $19,016 | $13,949 |
| Standard Deviation (Population) | $18,947 | $13,773 |
Similar Demographics by Median Earnings
Demographics Similar to Immigrants from South Central Asia by Median Earnings
In terms of median earnings, the demographic groups most similar to Immigrants from South Central Asia are Immigrants from Israel ($57,034, a difference of 0.14%), Immigrants from Ireland ($56,854, a difference of 0.46%), Okinawan ($57,550, a difference of 0.76%), Immigrants from China ($56,638, a difference of 0.84%), and Immigrants from Iran ($57,612, a difference of 0.87%).
| Demographics | Rating | Rank | Median Earnings |
| Immigrants | India | 100.0 /100 | #3 | Exceptional $60,648 |
| Immigrants | Hong Kong | 100.0 /100 | #4 | Exceptional $59,433 |
| Thais | 100.0 /100 | #5 | Exceptional $59,237 |
| Immigrants | Singapore | 100.0 /100 | #6 | Exceptional $59,038 |
| Iranians | 100.0 /100 | #7 | Exceptional $58,474 |
| Immigrants | Iran | 100.0 /100 | #8 | Exceptional $57,612 |
| Okinawans | 100.0 /100 | #9 | Exceptional $57,550 |
| Immigrants | South Central Asia | 100.0 /100 | #10 | Exceptional $57,114 |
| Immigrants | Israel | 100.0 /100 | #11 | Exceptional $57,034 |
| Immigrants | Ireland | 100.0 /100 | #12 | Exceptional $56,854 |
| Immigrants | China | 100.0 /100 | #13 | Exceptional $56,638 |
| Immigrants | Australia | 100.0 /100 | #14 | Exceptional $56,305 |
| Indians (Asian) | 100.0 /100 | #15 | Exceptional $56,253 |
| Immigrants | Eastern Asia | 100.0 /100 | #16 | Exceptional $56,183 |
| Eastern Europeans | 100.0 /100 | #17 | Exceptional $55,084 |
Demographics Similar to Immigrants from England by Median Earnings
In terms of median earnings, the demographic groups most similar to Immigrants from England are Croatian ($49,724, a difference of 0.0%), Immigrants from Lebanon ($49,682, a difference of 0.080%), Immigrants from North Macedonia ($49,658, a difference of 0.13%), Immigrants from Northern Africa ($49,648, a difference of 0.15%), and Armenian ($49,804, a difference of 0.16%).
| Demographics | Rating | Rank | Median Earnings |
| Albanians | 99.4 /100 | #88 | Exceptional $50,116 |
| Immigrants | North America | 99.4 /100 | #89 | Exceptional $50,108 |
| Italians | 99.3 /100 | #90 | Exceptional $49,915 |
| Macedonians | 99.2 /100 | #91 | Exceptional $49,893 |
| Immigrants | Argentina | 99.2 /100 | #92 | Exceptional $49,841 |
| Armenians | 99.1 /100 | #93 | Exceptional $49,804 |
| Croatians | 99.0 /100 | #94 | Exceptional $49,724 |
| Immigrants | England | 99.0 /100 | #95 | Exceptional $49,722 |
| Immigrants | Lebanon | 99.0 /100 | #96 | Exceptional $49,682 |
| Immigrants | North Macedonia | 98.9 /100 | #97 | Exceptional $49,658 |
| Immigrants | Northern Africa | 98.9 /100 | #98 | Exceptional $49,648 |
| Immigrants | Afghanistan | 98.9 /100 | #99 | Exceptional $49,645 |
| Immigrants | Poland | 98.9 /100 | #100 | Exceptional $49,633 |
| Jordanians | 98.9 /100 | #101 | Exceptional $49,632 |
| Ethiopians | 98.8 /100 | #102 | Exceptional $49,572 |