Immigrants from South Central Asia vs Cambodian Median Earnings
COMPARE
Immigrants from South Central Asia
Cambodian
Median Earnings
Median Earnings Comparison
Immigrants from South Central Asia
Cambodians
$57,114
MEDIAN EARNINGS
100.0/ 100
METRIC RATING
10th/ 347
METRIC RANK
$53,386
MEDIAN EARNINGS
100.0/ 100
METRIC RATING
30th/ 347
METRIC RANK
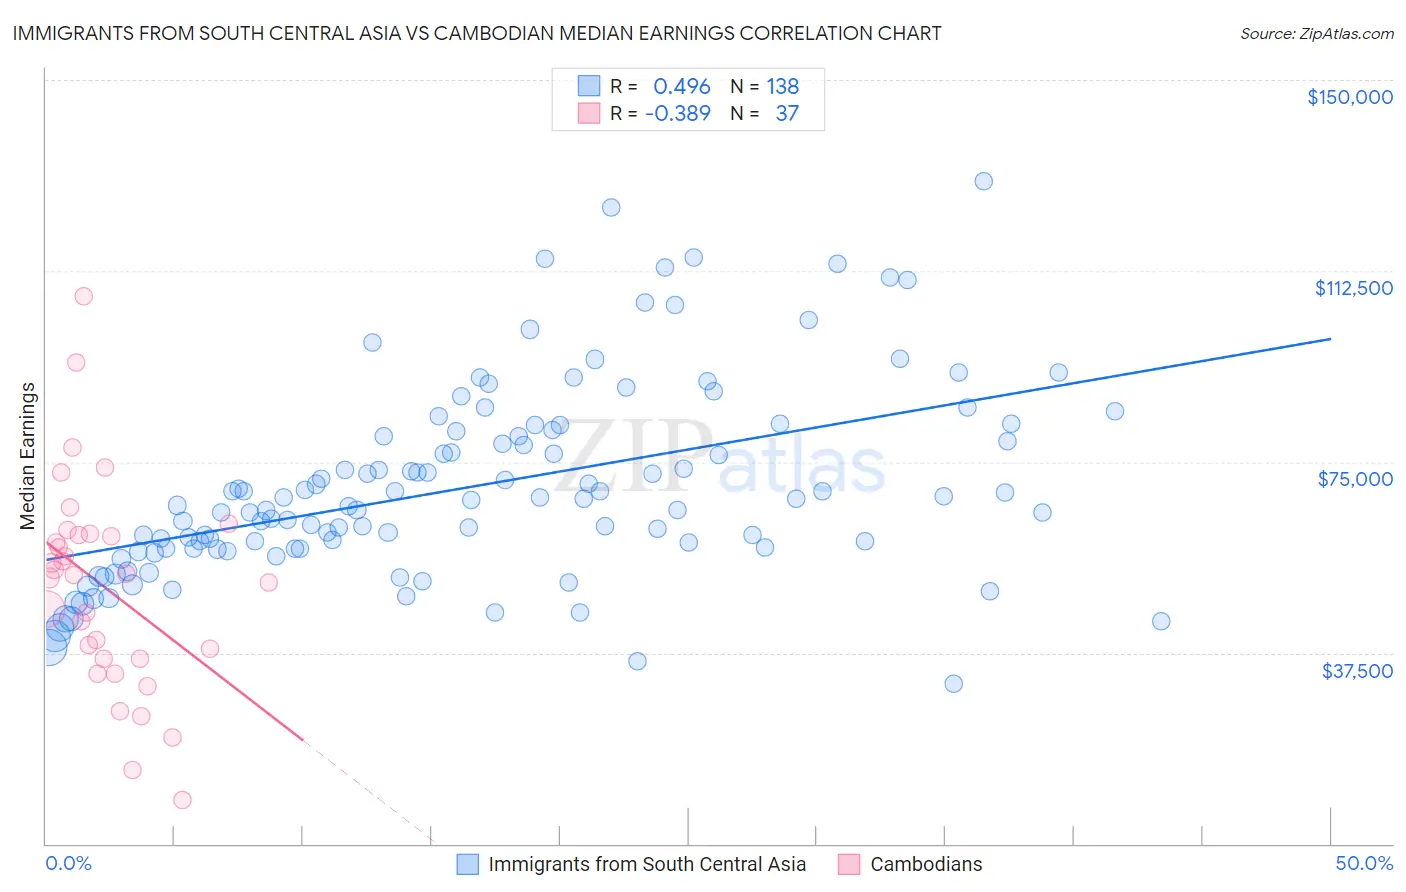
Immigrants from South Central Asia vs Cambodian Median Earnings Correlation Chart
The statistical analysis conducted on geographies consisting of 473,088,243 people shows a moderate positive correlation between the proportion of Immigrants from South Central Asia and median earnings in the United States with a correlation coefficient (R) of 0.496 and weighted average of $57,114. Similarly, the statistical analysis conducted on geographies consisting of 102,521,064 people shows a mild negative correlation between the proportion of Cambodians and median earnings in the United States with a correlation coefficient (R) of -0.389 and weighted average of $53,386, a difference of 7.0%.
Median Earnings Correlation Summary
| Measurement | Immigrants from South Central Asia | Cambodian |
| Minimum | $31,327 | $8,623 |
| Maximum | $130,186 | $107,569 |
| Range | $98,859 | $98,946 |
| Mean | $69,984 | $50,400 |
| Median | $66,961 | $52,839 |
| Interquartile 25% (IQ1) | $57,896 | $36,414 |
| Interquartile 75% (IQ3) | $80,093 | $60,699 |
| Interquartile Range (IQR) | $22,197 | $24,284 |
| Standard Deviation (Sample) | $19,016 | $20,473 |
| Standard Deviation (Population) | $18,947 | $20,194 |
Demographics Similar to Immigrants from South Central Asia and Cambodians by Median Earnings
In terms of median earnings, the demographic groups most similar to Immigrants from South Central Asia are Immigrants from Israel ($57,034, a difference of 0.14%), Immigrants from Ireland ($56,854, a difference of 0.46%), Immigrants from China ($56,638, a difference of 0.84%), Immigrants from Australia ($56,305, a difference of 1.4%), and Indian (Asian) ($56,253, a difference of 1.5%). Similarly, the demographic groups most similar to Cambodians are Immigrants from Russia ($53,457, a difference of 0.13%), Immigrants from France ($53,490, a difference of 0.20%), Asian ($53,690, a difference of 0.57%), Immigrants from Northern Europe ($53,872, a difference of 0.91%), and Turkish ($53,919, a difference of 1.0%).
| Demographics | Rating | Rank | Median Earnings |
| Immigrants | South Central Asia | 100.0 /100 | #10 | Exceptional $57,114 |
| Immigrants | Israel | 100.0 /100 | #11 | Exceptional $57,034 |
| Immigrants | Ireland | 100.0 /100 | #12 | Exceptional $56,854 |
| Immigrants | China | 100.0 /100 | #13 | Exceptional $56,638 |
| Immigrants | Australia | 100.0 /100 | #14 | Exceptional $56,305 |
| Indians (Asian) | 100.0 /100 | #15 | Exceptional $56,253 |
| Immigrants | Eastern Asia | 100.0 /100 | #16 | Exceptional $56,183 |
| Eastern Europeans | 100.0 /100 | #17 | Exceptional $55,084 |
| Immigrants | Japan | 100.0 /100 | #18 | Exceptional $54,938 |
| Immigrants | Belgium | 100.0 /100 | #19 | Exceptional $54,679 |
| Cypriots | 100.0 /100 | #20 | Exceptional $54,589 |
| Burmese | 100.0 /100 | #21 | Exceptional $54,559 |
| Immigrants | Korea | 100.0 /100 | #22 | Exceptional $54,530 |
| Immigrants | Sweden | 100.0 /100 | #23 | Exceptional $54,478 |
| Soviet Union | 100.0 /100 | #24 | Exceptional $54,290 |
| Turks | 100.0 /100 | #25 | Exceptional $53,919 |
| Immigrants | Northern Europe | 100.0 /100 | #26 | Exceptional $53,872 |
| Asians | 100.0 /100 | #27 | Exceptional $53,690 |
| Immigrants | France | 100.0 /100 | #28 | Exceptional $53,490 |
| Immigrants | Russia | 100.0 /100 | #29 | Exceptional $53,457 |
| Cambodians | 100.0 /100 | #30 | Exceptional $53,386 |