Immigrants from South Central Asia vs Turkish Wage/Income Gap
COMPARE
Immigrants from South Central Asia
Turkish
Wage/Income Gap
Wage/Income Gap Comparison
Immigrants from South Central Asia
Turks
29.3%
WAGE/INCOME GAP
0.0/ 100
METRIC RATING
332nd/ 347
METRIC RANK
27.7%
WAGE/INCOME GAP
1.0/ 100
METRIC RATING
267th/ 347
METRIC RANK
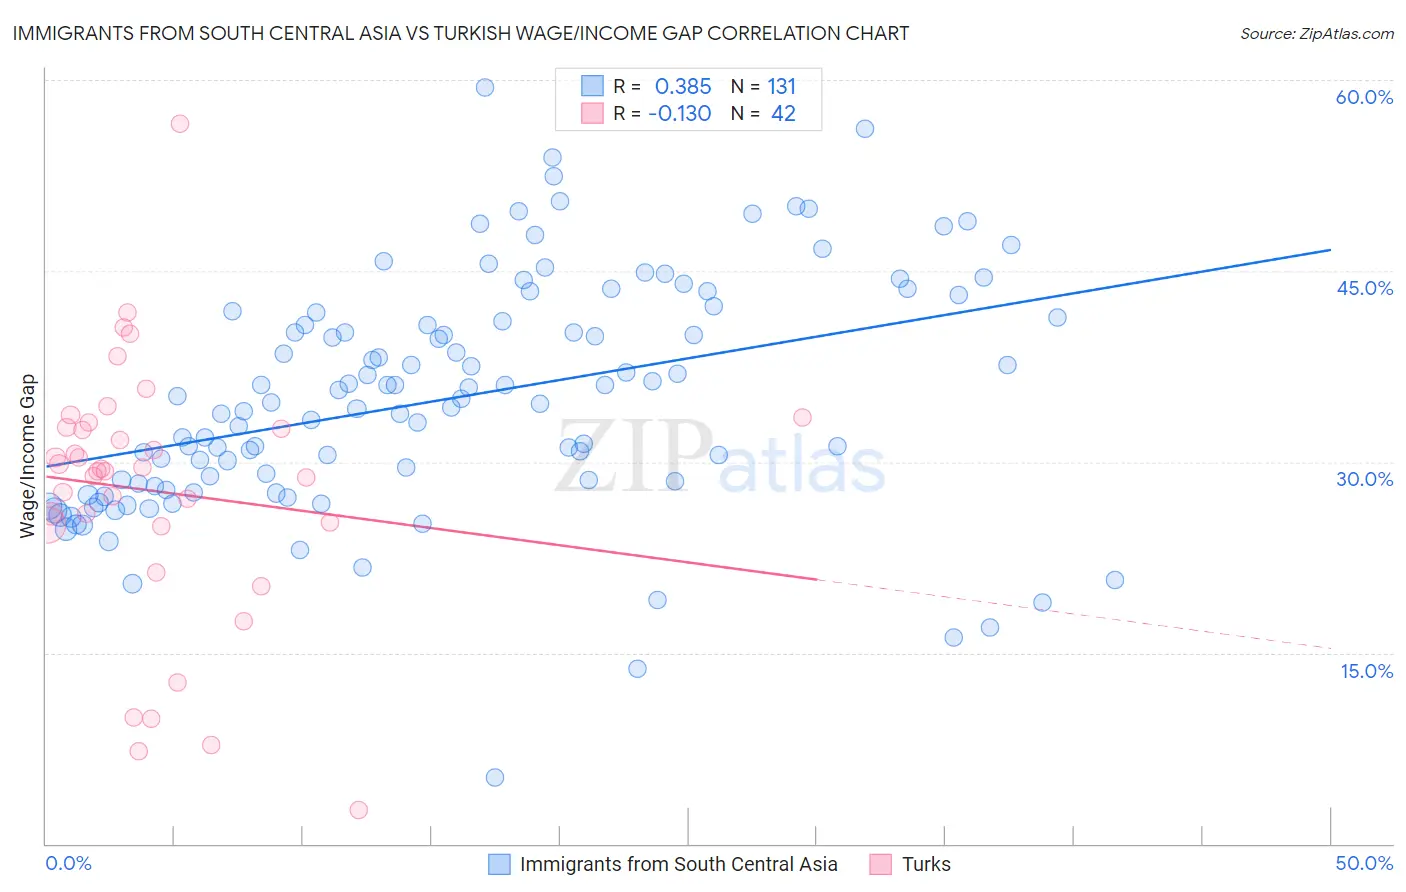
Immigrants from South Central Asia vs Turkish Wage/Income Gap Correlation Chart
The statistical analysis conducted on geographies consisting of 472,660,484 people shows a mild positive correlation between the proportion of Immigrants from South Central Asia and wage/income gap percentage in the United States with a correlation coefficient (R) of 0.385 and weighted average of 29.3%. Similarly, the statistical analysis conducted on geographies consisting of 271,781,198 people shows a poor negative correlation between the proportion of Turks and wage/income gap percentage in the United States with a correlation coefficient (R) of -0.130 and weighted average of 27.7%, a difference of 5.9%.
Wage/Income Gap Correlation Summary
| Measurement | Immigrants from South Central Asia | Turkish |
| Minimum | 5.2% | 2.6% |
| Maximum | 59.4% | 56.6% |
| Range | 54.2% | 54.0% |
| Mean | 34.9% | 27.7% |
| Median | 34.6% | 29.3% |
| Interquartile 25% (IQ1) | 28.1% | 25.1% |
| Interquartile 75% (IQ3) | 41.3% | 32.7% |
| Interquartile Range (IQR) | 13.2% | 7.6% |
| Standard Deviation (Sample) | 9.3% | 10.3% |
| Standard Deviation (Population) | 9.2% | 10.2% |
Similar Demographics by Wage/Income Gap
Demographics Similar to Immigrants from South Central Asia by Wage/Income Gap
In terms of wage/income gap, the demographic groups most similar to Immigrants from South Central Asia are European (29.4%, a difference of 0.19%), Swedish (29.4%, a difference of 0.34%), Immigrants from Taiwan (29.5%, a difference of 0.46%), English (29.5%, a difference of 0.47%), and Czech (29.2%, a difference of 0.51%).
| Demographics | Rating | Rank | Wage/Income Gap |
| Hungarians | 0.0 /100 | #325 | Tragic 29.0% |
| Immigrants | Belgium | 0.0 /100 | #326 | Tragic 29.0% |
| Immigrants | Iran | 0.0 /100 | #327 | Tragic 29.1% |
| Scandinavians | 0.0 /100 | #328 | Tragic 29.1% |
| Scottish | 0.0 /100 | #329 | Tragic 29.1% |
| Germans | 0.0 /100 | #330 | Tragic 29.2% |
| Czechs | 0.0 /100 | #331 | Tragic 29.2% |
| Immigrants | South Central Asia | 0.0 /100 | #332 | Tragic 29.3% |
| Europeans | 0.0 /100 | #333 | Tragic 29.4% |
| Swedes | 0.0 /100 | #334 | Tragic 29.4% |
| Immigrants | Taiwan | 0.0 /100 | #335 | Tragic 29.5% |
| English | 0.0 /100 | #336 | Tragic 29.5% |
| Dutch | 0.0 /100 | #337 | Tragic 29.6% |
| Filipinos | 0.0 /100 | #338 | Tragic 29.7% |
| Iranians | 0.0 /100 | #339 | Tragic 29.7% |
Demographics Similar to Turks by Wage/Income Gap
In terms of wage/income gap, the demographic groups most similar to Turks are Immigrants from Switzerland (27.7%, a difference of 0.020%), Serbian (27.7%, a difference of 0.020%), Hmong (27.7%, a difference of 0.020%), New Zealander (27.7%, a difference of 0.080%), and Potawatomi (27.7%, a difference of 0.090%).
| Demographics | Rating | Rank | Wage/Income Gap |
| Tongans | 1.7 /100 | #260 | Tragic 27.5% |
| Immigrants | Germany | 1.5 /100 | #261 | Tragic 27.5% |
| Immigrants | Lebanon | 1.5 /100 | #262 | Tragic 27.5% |
| Syrians | 1.4 /100 | #263 | Tragic 27.6% |
| Immigrants | Switzerland | 1.0 /100 | #264 | Tragic 27.7% |
| Serbians | 1.0 /100 | #265 | Tragic 27.7% |
| Hmong | 1.0 /100 | #266 | Tragic 27.7% |
| Turks | 1.0 /100 | #267 | Tragic 27.7% |
| New Zealanders | 1.0 /100 | #268 | Tragic 27.7% |
| Potawatomi | 0.9 /100 | #269 | Tragic 27.7% |
| Immigrants | Western Europe | 0.9 /100 | #270 | Tragic 27.8% |
| Ute | 0.8 /100 | #271 | Tragic 27.8% |
| Immigrants | Korea | 0.8 /100 | #272 | Tragic 27.8% |
| Bulgarians | 0.7 /100 | #273 | Tragic 27.8% |
| Americans | 0.7 /100 | #274 | Tragic 27.8% |