Immigrants from South Central Asia vs Turkish Unemployment Among Ages 60 to 64 years
COMPARE
Immigrants from South Central Asia
Turkish
Unemployment Among Ages 60 to 64 years
Unemployment Among Ages 60 to 64 years Comparison
Immigrants from South Central Asia
Turks
4.7%
UNEMPLOYMENT AMONG AGES 60 TO 64 YEARS
93.0/ 100
METRIC RATING
126th/ 347
METRIC RANK
4.8%
UNEMPLOYMENT AMONG AGES 60 TO 64 YEARS
81.9/ 100
METRIC RATING
146th/ 347
METRIC RANK
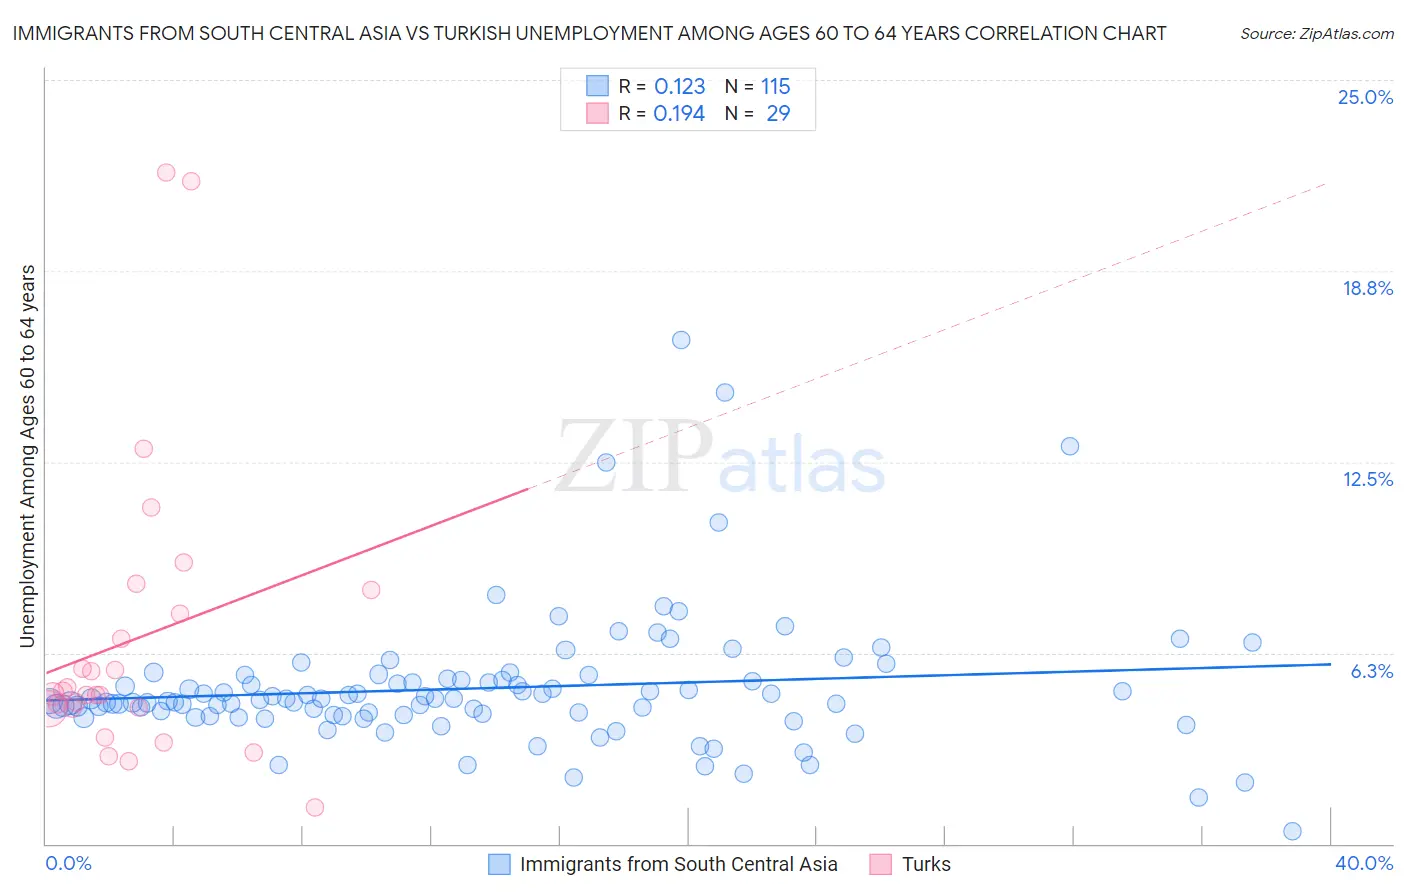
Immigrants from South Central Asia vs Turkish Unemployment Among Ages 60 to 64 years Correlation Chart
The statistical analysis conducted on geographies consisting of 418,199,861 people shows a poor positive correlation between the proportion of Immigrants from South Central Asia and unemployment rate among population between the ages 60 and 64 in the United States with a correlation coefficient (R) of 0.123 and weighted average of 4.7%. Similarly, the statistical analysis conducted on geographies consisting of 255,193,666 people shows a poor positive correlation between the proportion of Turks and unemployment rate among population between the ages 60 and 64 in the United States with a correlation coefficient (R) of 0.194 and weighted average of 4.8%, a difference of 0.97%.
Unemployment Among Ages 60 to 64 years Correlation Summary
| Measurement | Immigrants from South Central Asia | Turkish |
| Minimum | 0.40% | 1.2% |
| Maximum | 16.5% | 22.0% |
| Range | 16.1% | 20.8% |
| Mean | 5.1% | 6.7% |
| Median | 4.7% | 4.9% |
| Interquartile 25% (IQ1) | 4.2% | 4.4% |
| Interquartile 75% (IQ3) | 5.4% | 7.9% |
| Interquartile Range (IQR) | 1.2% | 3.5% |
| Standard Deviation (Sample) | 2.2% | 4.9% |
| Standard Deviation (Population) | 2.2% | 4.8% |
Demographics Similar to Immigrants from South Central Asia and Turks by Unemployment Among Ages 60 to 64 years
In terms of unemployment among ages 60 to 64 years, the demographic groups most similar to Immigrants from South Central Asia are Austrian (4.8%, a difference of 0.14%), Choctaw (4.8%, a difference of 0.32%), Immigrants from Serbia (4.8%, a difference of 0.33%), Immigrants from Syria (4.8%, a difference of 0.34%), and Immigrants from Lebanon (4.8%, a difference of 0.39%). Similarly, the demographic groups most similar to Turks are Burmese (4.8%, a difference of 0.080%), Immigrants from Pakistan (4.8%, a difference of 0.090%), Italian (4.8%, a difference of 0.20%), Immigrants from Ethiopia (4.8%, a difference of 0.23%), and Panamanian (4.8%, a difference of 0.24%).
| Demographics | Rating | Rank | Unemployment Among Ages 60 to 64 years |
| Immigrants | South Central Asia | 93.0 /100 | #126 | Exceptional 4.7% |
| Austrians | 91.9 /100 | #127 | Exceptional 4.8% |
| Choctaw | 90.3 /100 | #128 | Exceptional 4.8% |
| Immigrants | Serbia | 90.2 /100 | #129 | Exceptional 4.8% |
| Immigrants | Syria | 90.1 /100 | #130 | Exceptional 4.8% |
| Immigrants | Lebanon | 89.6 /100 | #131 | Excellent 4.8% |
| Lithuanians | 89.6 /100 | #132 | Excellent 4.8% |
| Yaqui | 89.5 /100 | #133 | Excellent 4.8% |
| Basques | 88.8 /100 | #134 | Excellent 4.8% |
| Pennsylvania Germans | 87.8 /100 | #135 | Excellent 4.8% |
| French Canadians | 87.6 /100 | #136 | Excellent 4.8% |
| Cambodians | 86.9 /100 | #137 | Excellent 4.8% |
| Immigrants | Lithuania | 86.7 /100 | #138 | Excellent 4.8% |
| Immigrants | Africa | 86.6 /100 | #139 | Excellent 4.8% |
| Pima | 85.8 /100 | #140 | Excellent 4.8% |
| Panamanians | 85.5 /100 | #141 | Excellent 4.8% |
| Immigrants | Ethiopia | 85.3 /100 | #142 | Excellent 4.8% |
| Italians | 85.0 /100 | #143 | Excellent 4.8% |
| Immigrants | Pakistan | 83.3 /100 | #144 | Excellent 4.8% |
| Burmese | 83.1 /100 | #145 | Excellent 4.8% |
| Turks | 81.9 /100 | #146 | Excellent 4.8% |