Immigrants from South Central Asia vs German Russian Householder Income Over 65 years
COMPARE
Immigrants from South Central Asia
German Russian
Householder Income Over 65 years
Householder Income Over 65 years Comparison
Immigrants from South Central Asia
German Russians
$70,103
HOUSEHOLDER INCOME OVER 65 YEARS
100.0/ 100
METRIC RATING
20th/ 347
METRIC RANK
$55,356
HOUSEHOLDER INCOME OVER 65 YEARS
0.3/ 100
METRIC RATING
256th/ 347
METRIC RANK
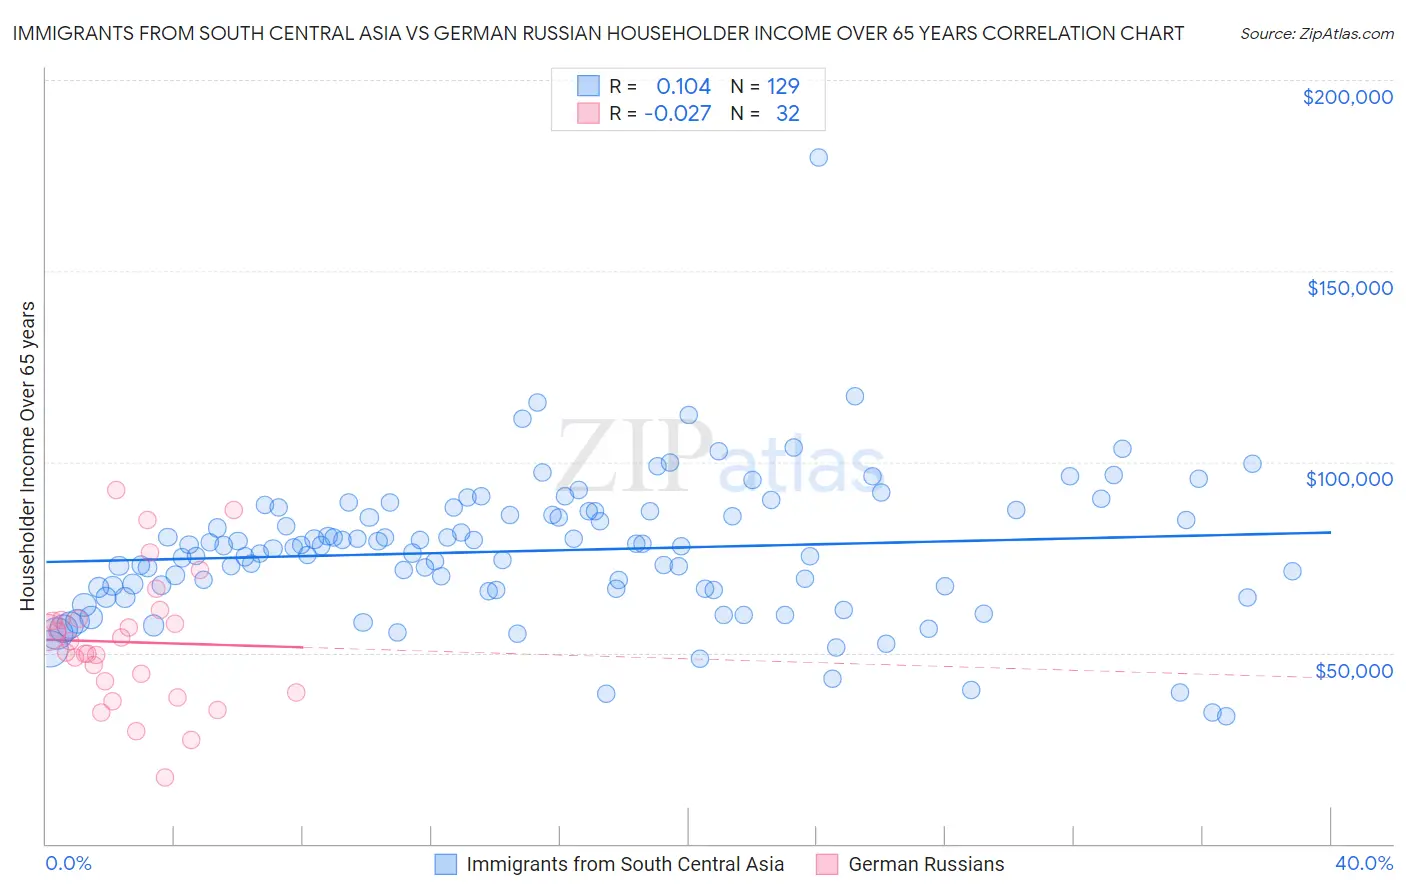
Immigrants from South Central Asia vs German Russian Householder Income Over 65 years Correlation Chart
The statistical analysis conducted on geographies consisting of 470,970,472 people shows a poor positive correlation between the proportion of Immigrants from South Central Asia and household income with householder over the age of 65 in the United States with a correlation coefficient (R) of 0.104 and weighted average of $70,103. Similarly, the statistical analysis conducted on geographies consisting of 96,303,967 people shows no correlation between the proportion of German Russians and household income with householder over the age of 65 in the United States with a correlation coefficient (R) of -0.027 and weighted average of $55,356, a difference of 26.6%.
Householder Income Over 65 years Correlation Summary
| Measurement | Immigrants from South Central Asia | German Russian |
| Minimum | $33,500 | $17,222 |
| Maximum | $179,808 | $92,589 |
| Range | $146,308 | $75,367 |
| Mean | $76,705 | $52,783 |
| Median | $77,625 | $51,516 |
| Interquartile 25% (IQ1) | $66,593 | $41,107 |
| Interquartile 75% (IQ3) | $87,098 | $58,681 |
| Interquartile Range (IQR) | $20,505 | $17,574 |
| Standard Deviation (Sample) | $18,654 | $17,181 |
| Standard Deviation (Population) | $18,582 | $16,911 |
Similar Demographics by Householder Income Over 65 years
Demographics Similar to Immigrants from South Central Asia by Householder Income Over 65 years
In terms of householder income over 65 years, the demographic groups most similar to Immigrants from South Central Asia are Indian (Asian) ($70,238, a difference of 0.19%), Immigrants from Eastern Asia ($69,872, a difference of 0.33%), Immigrants from Israel ($69,857, a difference of 0.35%), Immigrants from Japan ($69,774, a difference of 0.47%), and Eastern European ($70,470, a difference of 0.52%).
| Demographics | Rating | Rank | Householder Income Over 65 years |
| Immigrants | Hong Kong | 100.0 /100 | #13 | Exceptional $71,567 |
| Burmese | 100.0 /100 | #14 | Exceptional $71,139 |
| Native Hawaiians | 100.0 /100 | #15 | Exceptional $71,021 |
| Okinawans | 100.0 /100 | #16 | Exceptional $70,846 |
| Immigrants | Korea | 100.0 /100 | #17 | Exceptional $70,696 |
| Eastern Europeans | 100.0 /100 | #18 | Exceptional $70,470 |
| Indians (Asian) | 100.0 /100 | #19 | Exceptional $70,238 |
| Immigrants | South Central Asia | 100.0 /100 | #20 | Exceptional $70,103 |
| Immigrants | Eastern Asia | 100.0 /100 | #21 | Exceptional $69,872 |
| Immigrants | Israel | 100.0 /100 | #22 | Exceptional $69,857 |
| Immigrants | Japan | 100.0 /100 | #23 | Exceptional $69,774 |
| Immigrants | Sweden | 100.0 /100 | #24 | Exceptional $69,722 |
| Immigrants | Belgium | 100.0 /100 | #25 | Exceptional $69,703 |
| Immigrants | Sri Lanka | 100.0 /100 | #26 | Exceptional $69,426 |
| Immigrants | Switzerland | 100.0 /100 | #27 | Exceptional $69,343 |
Demographics Similar to German Russians by Householder Income Over 65 years
In terms of householder income over 65 years, the demographic groups most similar to German Russians are Trinidadian and Tobagonian ($55,327, a difference of 0.050%), Immigrants from Bangladesh ($55,394, a difference of 0.070%), American ($55,527, a difference of 0.31%), Immigrants from Trinidad and Tobago ($55,598, a difference of 0.44%), and Osage ($55,677, a difference of 0.58%).
| Demographics | Rating | Rank | Householder Income Over 65 years |
| Mexican American Indians | 0.6 /100 | #249 | Tragic $56,089 |
| Immigrants | Bosnia and Herzegovina | 0.5 /100 | #250 | Tragic $55,986 |
| Immigrants | Portugal | 0.5 /100 | #251 | Tragic $55,924 |
| Osage | 0.4 /100 | #252 | Tragic $55,677 |
| Immigrants | Trinidad and Tobago | 0.4 /100 | #253 | Tragic $55,598 |
| Americans | 0.3 /100 | #254 | Tragic $55,527 |
| Immigrants | Bangladesh | 0.3 /100 | #255 | Tragic $55,394 |
| German Russians | 0.3 /100 | #256 | Tragic $55,356 |
| Trinidadians and Tobagonians | 0.3 /100 | #257 | Tragic $55,327 |
| Ecuadorians | 0.2 /100 | #258 | Tragic $54,958 |
| West Indians | 0.2 /100 | #259 | Tragic $54,936 |
| Immigrants | West Indies | 0.2 /100 | #260 | Tragic $54,927 |
| Comanche | 0.2 /100 | #261 | Tragic $54,922 |
| Bangladeshis | 0.1 /100 | #262 | Tragic $54,719 |
| French American Indians | 0.1 /100 | #263 | Tragic $54,699 |