Immigrants from South Central Asia vs Russian Householder Income Over 65 years
COMPARE
Immigrants from South Central Asia
Russian
Householder Income Over 65 years
Householder Income Over 65 years Comparison
Immigrants from South Central Asia
Russians
$70,103
HOUSEHOLDER INCOME OVER 65 YEARS
100.0/ 100
METRIC RATING
20th/ 347
METRIC RANK
$67,626
HOUSEHOLDER INCOME OVER 65 YEARS
99.9/ 100
METRIC RATING
39th/ 347
METRIC RANK
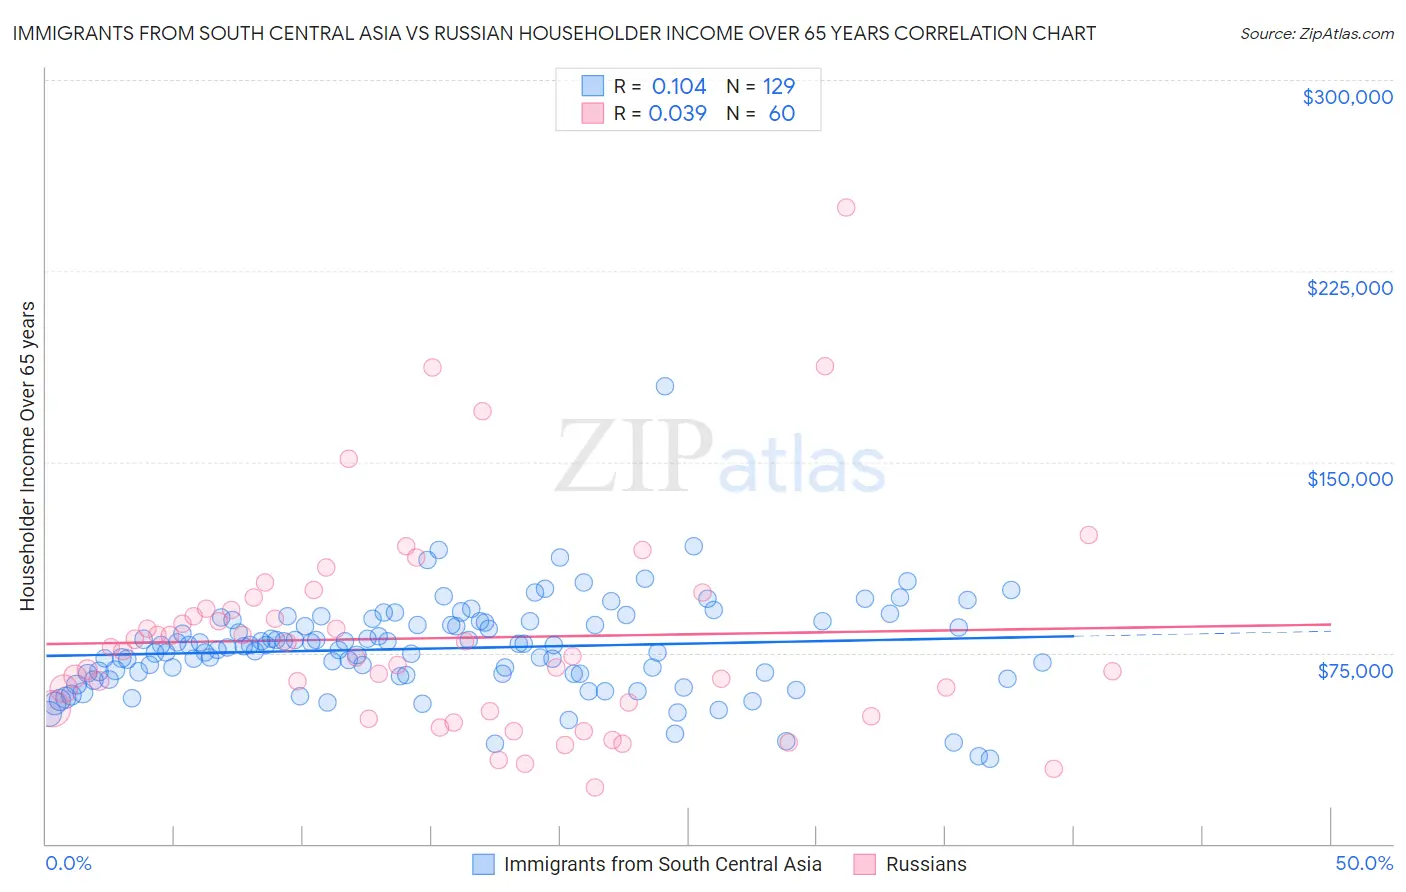
Immigrants from South Central Asia vs Russian Householder Income Over 65 years Correlation Chart
The statistical analysis conducted on geographies consisting of 470,970,472 people shows a poor positive correlation between the proportion of Immigrants from South Central Asia and household income with householder over the age of 65 in the United States with a correlation coefficient (R) of 0.104 and weighted average of $70,103. Similarly, the statistical analysis conducted on geographies consisting of 509,158,654 people shows no correlation between the proportion of Russians and household income with householder over the age of 65 in the United States with a correlation coefficient (R) of 0.039 and weighted average of $67,626, a difference of 3.7%.
Householder Income Over 65 years Correlation Summary
| Measurement | Immigrants from South Central Asia | Russian |
| Minimum | $33,500 | $22,236 |
| Maximum | $179,808 | $250,001 |
| Range | $146,308 | $227,765 |
| Mean | $76,705 | $80,788 |
| Median | $77,625 | $74,810 |
| Interquartile 25% (IQ1) | $66,593 | $52,373 |
| Interquartile 75% (IQ3) | $87,098 | $92,060 |
| Interquartile Range (IQR) | $20,505 | $39,687 |
| Standard Deviation (Sample) | $18,654 | $41,509 |
| Standard Deviation (Population) | $18,582 | $41,162 |
Demographics Similar to Immigrants from South Central Asia and Russians by Householder Income Over 65 years
In terms of householder income over 65 years, the demographic groups most similar to Immigrants from South Central Asia are Indian (Asian) ($70,238, a difference of 0.19%), Immigrants from Eastern Asia ($69,872, a difference of 0.33%), Immigrants from Israel ($69,857, a difference of 0.35%), Immigrants from Japan ($69,774, a difference of 0.47%), and Immigrants from Sweden ($69,722, a difference of 0.55%). Similarly, the demographic groups most similar to Russians are Estonian ($67,926, a difference of 0.44%), Turkish ($68,037, a difference of 0.61%), Immigrants from Austria ($68,208, a difference of 0.86%), Tongan ($68,235, a difference of 0.90%), and Immigrants from Ireland ($68,495, a difference of 1.3%).
| Demographics | Rating | Rank | Householder Income Over 65 years |
| Indians (Asian) | 100.0 /100 | #19 | Exceptional $70,238 |
| Immigrants | South Central Asia | 100.0 /100 | #20 | Exceptional $70,103 |
| Immigrants | Eastern Asia | 100.0 /100 | #21 | Exceptional $69,872 |
| Immigrants | Israel | 100.0 /100 | #22 | Exceptional $69,857 |
| Immigrants | Japan | 100.0 /100 | #23 | Exceptional $69,774 |
| Immigrants | Sweden | 100.0 /100 | #24 | Exceptional $69,722 |
| Immigrants | Belgium | 100.0 /100 | #25 | Exceptional $69,703 |
| Immigrants | Sri Lanka | 100.0 /100 | #26 | Exceptional $69,426 |
| Immigrants | Switzerland | 100.0 /100 | #27 | Exceptional $69,343 |
| Immigrants | China | 100.0 /100 | #28 | Exceptional $69,174 |
| Immigrants | Australia | 100.0 /100 | #29 | Exceptional $69,164 |
| Immigrants | Northern Europe | 100.0 /100 | #30 | Exceptional $69,003 |
| Afghans | 100.0 /100 | #31 | Exceptional $68,951 |
| Asians | 100.0 /100 | #32 | Exceptional $68,822 |
| Immigrants | Denmark | 100.0 /100 | #33 | Exceptional $68,801 |
| Immigrants | Ireland | 100.0 /100 | #34 | Exceptional $68,495 |
| Tongans | 100.0 /100 | #35 | Exceptional $68,235 |
| Immigrants | Austria | 99.9 /100 | #36 | Exceptional $68,208 |
| Turks | 99.9 /100 | #37 | Exceptional $68,037 |
| Estonians | 99.9 /100 | #38 | Exceptional $67,926 |
| Russians | 99.9 /100 | #39 | Exceptional $67,626 |