Immigrants from South Central Asia vs German Russian Disability Age 65 to 74
COMPARE
Immigrants from South Central Asia
German Russian
Disability Age 65 to 74
Disability Age 65 to 74 Comparison
Immigrants from South Central Asia
German Russians
20.6%
DISABILITY AGE 65 TO 74
100.0/ 100
METRIC RATING
17th/ 347
METRIC RANK
24.4%
DISABILITY AGE 65 TO 74
3.7/ 100
METRIC RATING
236th/ 347
METRIC RANK
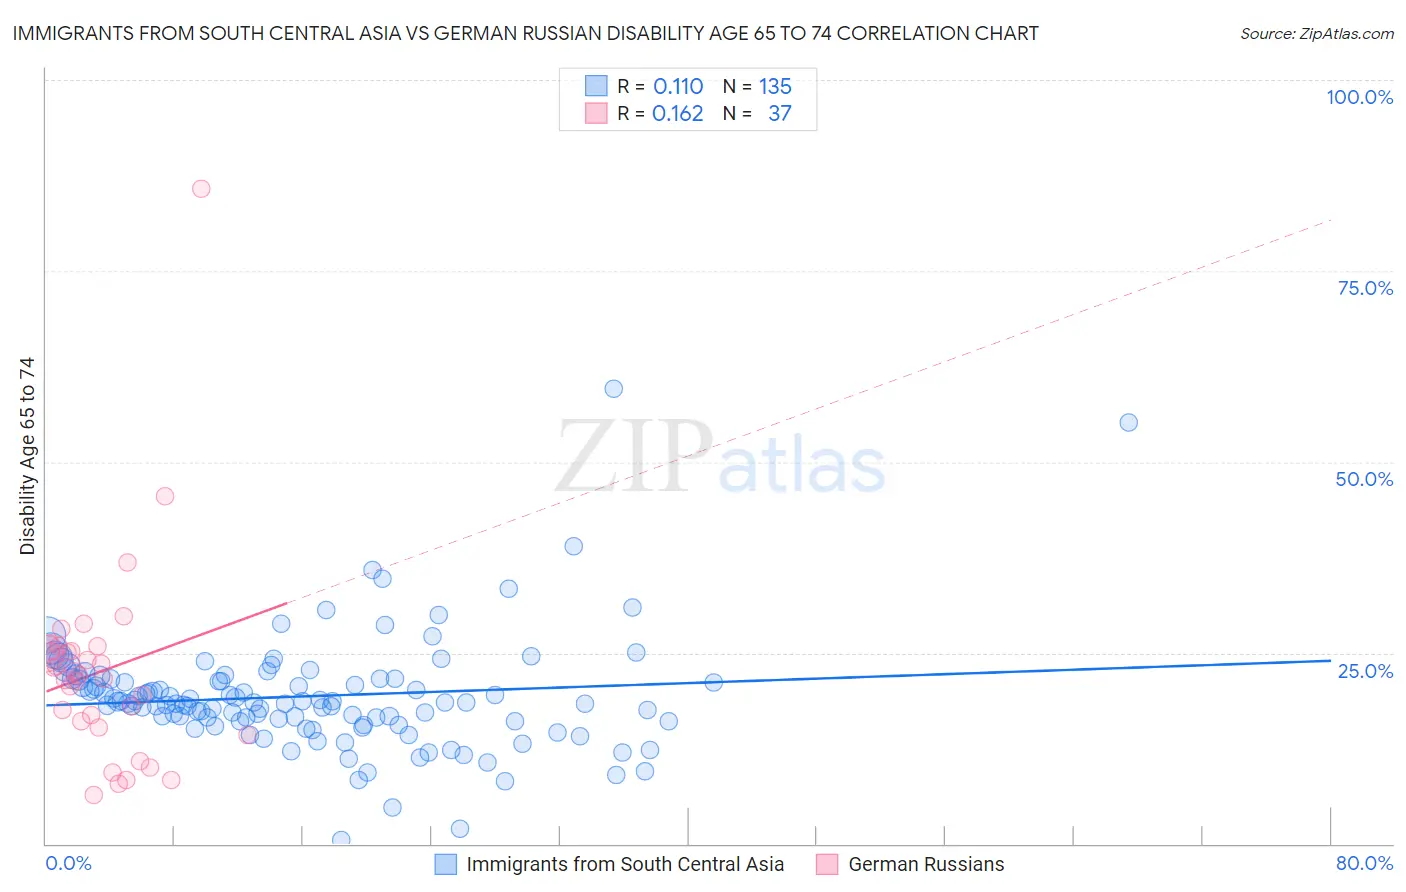
Immigrants from South Central Asia vs German Russian Disability Age 65 to 74 Correlation Chart
The statistical analysis conducted on geographies consisting of 471,844,047 people shows a poor positive correlation between the proportion of Immigrants from South Central Asia and percentage of population with a disability between the ages 65 and 75 in the United States with a correlation coefficient (R) of 0.110 and weighted average of 20.6%. Similarly, the statistical analysis conducted on geographies consisting of 96,383,103 people shows a poor positive correlation between the proportion of German Russians and percentage of population with a disability between the ages 65 and 75 in the United States with a correlation coefficient (R) of 0.162 and weighted average of 24.4%, a difference of 18.7%.
Disability Age 65 to 74 Correlation Summary
| Measurement | Immigrants from South Central Asia | German Russian |
| Minimum | 0.50% | 6.3% |
| Maximum | 59.5% | 85.7% |
| Range | 59.0% | 79.4% |
| Mean | 19.3% | 22.6% |
| Median | 18.5% | 22.1% |
| Interquartile 25% (IQ1) | 16.1% | 15.7% |
| Interquartile 75% (IQ3) | 21.6% | 25.5% |
| Interquartile Range (IQR) | 5.5% | 9.8% |
| Standard Deviation (Sample) | 7.5% | 13.5% |
| Standard Deviation (Population) | 7.5% | 13.3% |
Similar Demographics by Disability Age 65 to 74
Demographics Similar to Immigrants from South Central Asia by Disability Age 65 to 74
In terms of disability age 65 to 74, the demographic groups most similar to Immigrants from South Central Asia are Eastern European (20.6%, a difference of 0.070%), Burmese (20.6%, a difference of 0.10%), Immigrants from Lithuania (20.5%, a difference of 0.25%), Paraguayan (20.5%, a difference of 0.31%), and Indian (Asian) (20.5%, a difference of 0.33%).
| Demographics | Rating | Rank | Disability Age 65 to 74 |
| Immigrants | Eastern Asia | 100.0 /100 | #10 | Exceptional 20.3% |
| Immigrants | Ireland | 100.0 /100 | #11 | Exceptional 20.3% |
| Immigrants | Korea | 100.0 /100 | #12 | Exceptional 20.4% |
| Immigrants | Singapore | 100.0 /100 | #13 | Exceptional 20.4% |
| Indians (Asian) | 100.0 /100 | #14 | Exceptional 20.5% |
| Paraguayans | 100.0 /100 | #15 | Exceptional 20.5% |
| Immigrants | Lithuania | 100.0 /100 | #16 | Exceptional 20.5% |
| Immigrants | South Central Asia | 100.0 /100 | #17 | Exceptional 20.6% |
| Eastern Europeans | 100.0 /100 | #18 | Exceptional 20.6% |
| Burmese | 100.0 /100 | #19 | Exceptional 20.6% |
| Okinawans | 100.0 /100 | #20 | Exceptional 20.7% |
| Immigrants | Bolivia | 99.9 /100 | #21 | Exceptional 20.8% |
| Immigrants | Iran | 99.9 /100 | #22 | Exceptional 20.9% |
| Immigrants | Belgium | 99.9 /100 | #23 | Exceptional 21.0% |
| Soviet Union | 99.9 /100 | #24 | Exceptional 21.0% |
Demographics Similar to German Russians by Disability Age 65 to 74
In terms of disability age 65 to 74, the demographic groups most similar to German Russians are Scotch-Irish (24.4%, a difference of 0.040%), West Indian (24.5%, a difference of 0.10%), Panamanian (24.4%, a difference of 0.19%), Immigrants from Ghana (24.5%, a difference of 0.27%), and Bahamian (24.4%, a difference of 0.30%).
| Demographics | Rating | Rank | Disability Age 65 to 74 |
| Celtics | 6.4 /100 | #229 | Tragic 24.2% |
| Barbadians | 6.0 /100 | #230 | Tragic 24.3% |
| Immigrants | Thailand | 5.2 /100 | #231 | Tragic 24.3% |
| Immigrants | Zaire | 5.0 /100 | #232 | Tragic 24.3% |
| Bahamians | 4.5 /100 | #233 | Tragic 24.4% |
| Panamanians | 4.2 /100 | #234 | Tragic 24.4% |
| Scotch-Irish | 3.8 /100 | #235 | Tragic 24.4% |
| German Russians | 3.7 /100 | #236 | Tragic 24.4% |
| West Indians | 3.4 /100 | #237 | Tragic 24.5% |
| Immigrants | Ghana | 3.0 /100 | #238 | Tragic 24.5% |
| Immigrants | Caribbean | 2.6 /100 | #239 | Tragic 24.6% |
| Spaniards | 2.4 /100 | #240 | Tragic 24.6% |
| Immigrants | Western Africa | 2.3 /100 | #241 | Tragic 24.6% |
| Immigrants | Senegal | 2.2 /100 | #242 | Tragic 24.6% |
| Spanish | 2.2 /100 | #243 | Tragic 24.6% |