Asian vs German Russian Householder Income Over 65 years
COMPARE
Asian
German Russian
Householder Income Over 65 years
Householder Income Over 65 years Comparison
Asians
German Russians
$68,822
HOUSEHOLDER INCOME OVER 65 YEARS
100.0/ 100
METRIC RATING
32nd/ 347
METRIC RANK
$55,356
HOUSEHOLDER INCOME OVER 65 YEARS
0.3/ 100
METRIC RATING
256th/ 347
METRIC RANK
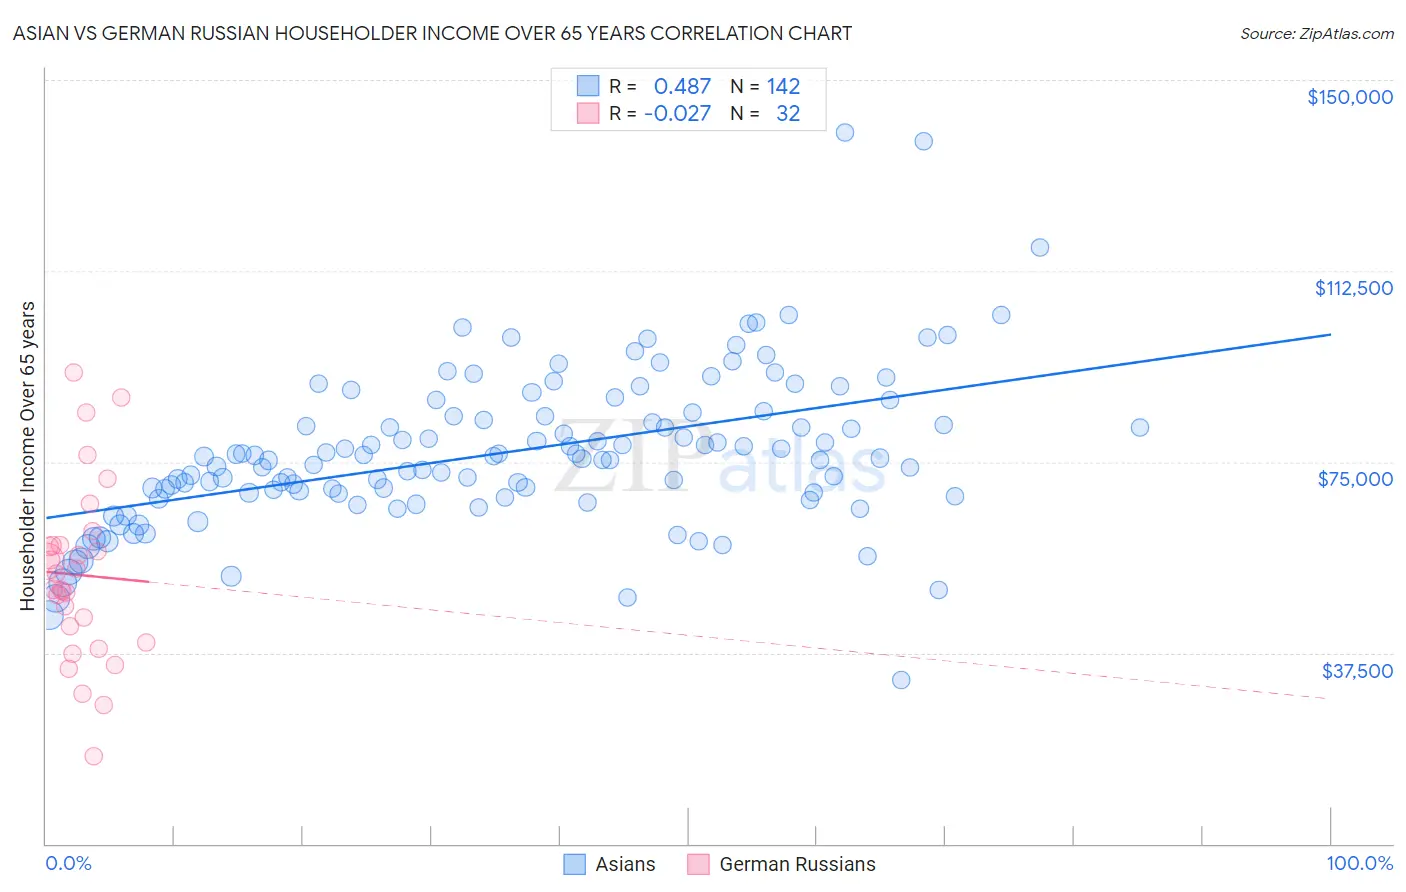
Asian vs German Russian Householder Income Over 65 years Correlation Chart
The statistical analysis conducted on geographies consisting of 546,636,612 people shows a moderate positive correlation between the proportion of Asians and household income with householder over the age of 65 in the United States with a correlation coefficient (R) of 0.487 and weighted average of $68,822. Similarly, the statistical analysis conducted on geographies consisting of 96,303,967 people shows no correlation between the proportion of German Russians and household income with householder over the age of 65 in the United States with a correlation coefficient (R) of -0.027 and weighted average of $55,356, a difference of 24.3%.
Householder Income Over 65 years Correlation Summary
| Measurement | Asian | German Russian |
| Minimum | $32,121 | $17,222 |
| Maximum | $139,689 | $92,589 |
| Range | $107,568 | $75,367 |
| Mean | $76,866 | $52,783 |
| Median | $75,680 | $51,516 |
| Interquartile 25% (IQ1) | $68,749 | $41,107 |
| Interquartile 75% (IQ3) | $84,063 | $58,681 |
| Interquartile Range (IQR) | $15,314 | $17,574 |
| Standard Deviation (Sample) | $15,572 | $17,181 |
| Standard Deviation (Population) | $15,517 | $16,911 |
Similar Demographics by Householder Income Over 65 years
Demographics Similar to Asians by Householder Income Over 65 years
In terms of householder income over 65 years, the demographic groups most similar to Asians are Immigrants from Denmark ($68,801, a difference of 0.030%), Afghan ($68,951, a difference of 0.19%), Immigrants from Northern Europe ($69,003, a difference of 0.26%), Immigrants from Ireland ($68,495, a difference of 0.48%), and Immigrants from Australia ($69,164, a difference of 0.50%).
| Demographics | Rating | Rank | Householder Income Over 65 years |
| Immigrants | Belgium | 100.0 /100 | #25 | Exceptional $69,703 |
| Immigrants | Sri Lanka | 100.0 /100 | #26 | Exceptional $69,426 |
| Immigrants | Switzerland | 100.0 /100 | #27 | Exceptional $69,343 |
| Immigrants | China | 100.0 /100 | #28 | Exceptional $69,174 |
| Immigrants | Australia | 100.0 /100 | #29 | Exceptional $69,164 |
| Immigrants | Northern Europe | 100.0 /100 | #30 | Exceptional $69,003 |
| Afghans | 100.0 /100 | #31 | Exceptional $68,951 |
| Asians | 100.0 /100 | #32 | Exceptional $68,822 |
| Immigrants | Denmark | 100.0 /100 | #33 | Exceptional $68,801 |
| Immigrants | Ireland | 100.0 /100 | #34 | Exceptional $68,495 |
| Tongans | 100.0 /100 | #35 | Exceptional $68,235 |
| Immigrants | Austria | 99.9 /100 | #36 | Exceptional $68,208 |
| Turks | 99.9 /100 | #37 | Exceptional $68,037 |
| Estonians | 99.9 /100 | #38 | Exceptional $67,926 |
| Russians | 99.9 /100 | #39 | Exceptional $67,626 |
Demographics Similar to German Russians by Householder Income Over 65 years
In terms of householder income over 65 years, the demographic groups most similar to German Russians are Trinidadian and Tobagonian ($55,327, a difference of 0.050%), Immigrants from Bangladesh ($55,394, a difference of 0.070%), American ($55,527, a difference of 0.31%), Immigrants from Trinidad and Tobago ($55,598, a difference of 0.44%), and Osage ($55,677, a difference of 0.58%).
| Demographics | Rating | Rank | Householder Income Over 65 years |
| Mexican American Indians | 0.6 /100 | #249 | Tragic $56,089 |
| Immigrants | Bosnia and Herzegovina | 0.5 /100 | #250 | Tragic $55,986 |
| Immigrants | Portugal | 0.5 /100 | #251 | Tragic $55,924 |
| Osage | 0.4 /100 | #252 | Tragic $55,677 |
| Immigrants | Trinidad and Tobago | 0.4 /100 | #253 | Tragic $55,598 |
| Americans | 0.3 /100 | #254 | Tragic $55,527 |
| Immigrants | Bangladesh | 0.3 /100 | #255 | Tragic $55,394 |
| German Russians | 0.3 /100 | #256 | Tragic $55,356 |
| Trinidadians and Tobagonians | 0.3 /100 | #257 | Tragic $55,327 |
| Ecuadorians | 0.2 /100 | #258 | Tragic $54,958 |
| West Indians | 0.2 /100 | #259 | Tragic $54,936 |
| Immigrants | West Indies | 0.2 /100 | #260 | Tragic $54,927 |
| Comanche | 0.2 /100 | #261 | Tragic $54,922 |
| Bangladeshis | 0.1 /100 | #262 | Tragic $54,719 |
| French American Indians | 0.1 /100 | #263 | Tragic $54,699 |