Immigrants from South Central Asia vs Immigrants from Latvia Householder Income Over 65 years
COMPARE
Immigrants from South Central Asia
Immigrants from Latvia
Householder Income Over 65 years
Householder Income Over 65 years Comparison
Immigrants from South Central Asia
Immigrants from Latvia
$70,103
HOUSEHOLDER INCOME OVER 65 YEARS
100.0/ 100
METRIC RATING
20th/ 347
METRIC RANK
$64,298
HOUSEHOLDER INCOME OVER 65 YEARS
97.0/ 100
METRIC RATING
95th/ 347
METRIC RANK
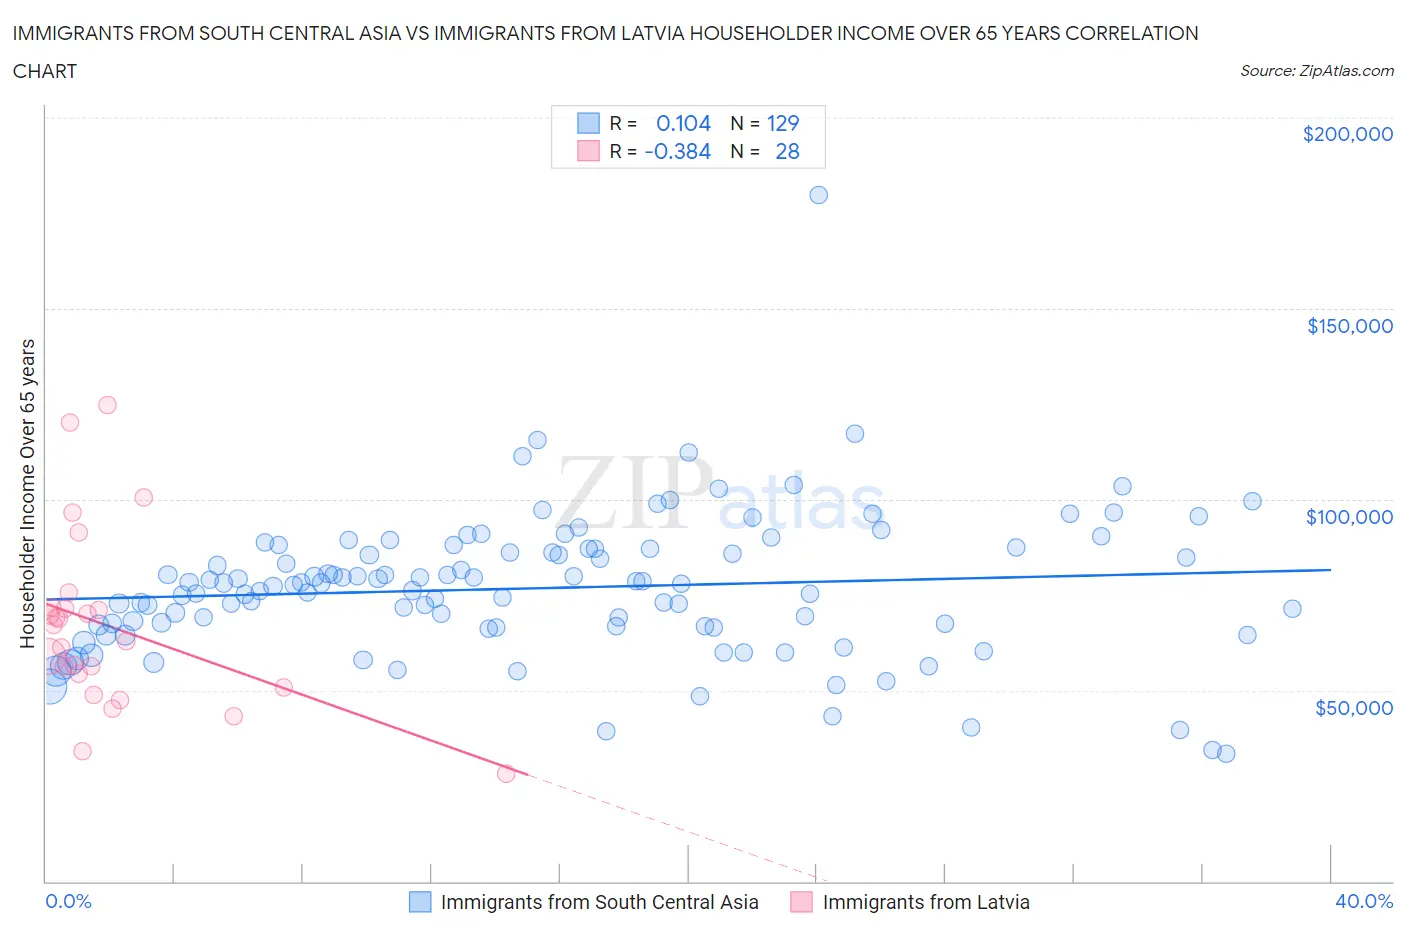
Immigrants from South Central Asia vs Immigrants from Latvia Householder Income Over 65 years Correlation Chart
The statistical analysis conducted on geographies consisting of 470,970,472 people shows a poor positive correlation between the proportion of Immigrants from South Central Asia and household income with householder over the age of 65 in the United States with a correlation coefficient (R) of 0.104 and weighted average of $70,103. Similarly, the statistical analysis conducted on geographies consisting of 113,654,175 people shows a mild negative correlation between the proportion of Immigrants from Latvia and household income with householder over the age of 65 in the United States with a correlation coefficient (R) of -0.384 and weighted average of $64,298, a difference of 9.0%.
Householder Income Over 65 years Correlation Summary
| Measurement | Immigrants from South Central Asia | Immigrants from Latvia |
| Minimum | $33,500 | $28,148 |
| Maximum | $179,808 | $124,787 |
| Range | $146,308 | $96,639 |
| Mean | $76,705 | $66,864 |
| Median | $77,625 | $65,041 |
| Interquartile 25% (IQ1) | $66,593 | $52,525 |
| Interquartile 75% (IQ3) | $87,098 | $71,607 |
| Interquartile Range (IQR) | $20,505 | $19,082 |
| Standard Deviation (Sample) | $18,654 | $22,839 |
| Standard Deviation (Population) | $18,582 | $22,427 |
Similar Demographics by Householder Income Over 65 years
Demographics Similar to Immigrants from South Central Asia by Householder Income Over 65 years
In terms of householder income over 65 years, the demographic groups most similar to Immigrants from South Central Asia are Indian (Asian) ($70,238, a difference of 0.19%), Immigrants from Eastern Asia ($69,872, a difference of 0.33%), Immigrants from Israel ($69,857, a difference of 0.35%), Immigrants from Japan ($69,774, a difference of 0.47%), and Eastern European ($70,470, a difference of 0.52%).
| Demographics | Rating | Rank | Householder Income Over 65 years |
| Immigrants | Hong Kong | 100.0 /100 | #13 | Exceptional $71,567 |
| Burmese | 100.0 /100 | #14 | Exceptional $71,139 |
| Native Hawaiians | 100.0 /100 | #15 | Exceptional $71,021 |
| Okinawans | 100.0 /100 | #16 | Exceptional $70,846 |
| Immigrants | Korea | 100.0 /100 | #17 | Exceptional $70,696 |
| Eastern Europeans | 100.0 /100 | #18 | Exceptional $70,470 |
| Indians (Asian) | 100.0 /100 | #19 | Exceptional $70,238 |
| Immigrants | South Central Asia | 100.0 /100 | #20 | Exceptional $70,103 |
| Immigrants | Eastern Asia | 100.0 /100 | #21 | Exceptional $69,872 |
| Immigrants | Israel | 100.0 /100 | #22 | Exceptional $69,857 |
| Immigrants | Japan | 100.0 /100 | #23 | Exceptional $69,774 |
| Immigrants | Sweden | 100.0 /100 | #24 | Exceptional $69,722 |
| Immigrants | Belgium | 100.0 /100 | #25 | Exceptional $69,703 |
| Immigrants | Sri Lanka | 100.0 /100 | #26 | Exceptional $69,426 |
| Immigrants | Switzerland | 100.0 /100 | #27 | Exceptional $69,343 |
Demographics Similar to Immigrants from Latvia by Householder Income Over 65 years
In terms of householder income over 65 years, the demographic groups most similar to Immigrants from Latvia are Immigrants from Egypt ($64,299, a difference of 0.0%), Jordanian ($64,313, a difference of 0.020%), Immigrants from Hungary ($64,277, a difference of 0.030%), Immigrants from Bulgaria ($64,379, a difference of 0.13%), and Sri Lankan ($64,201, a difference of 0.15%).
| Demographics | Rating | Rank | Householder Income Over 65 years |
| Immigrants | Romania | 97.5 /100 | #88 | Exceptional $64,462 |
| Paraguayans | 97.4 /100 | #89 | Exceptional $64,443 |
| Immigrants | Kuwait | 97.4 /100 | #90 | Exceptional $64,433 |
| Immigrants | Oceania | 97.4 /100 | #91 | Exceptional $64,416 |
| Immigrants | Bulgaria | 97.3 /100 | #92 | Exceptional $64,379 |
| Jordanians | 97.1 /100 | #93 | Exceptional $64,313 |
| Immigrants | Egypt | 97.0 /100 | #94 | Exceptional $64,299 |
| Immigrants | Latvia | 97.0 /100 | #95 | Exceptional $64,298 |
| Immigrants | Hungary | 97.0 /100 | #96 | Exceptional $64,277 |
| Sri Lankans | 96.7 /100 | #97 | Exceptional $64,201 |
| Romanians | 96.5 /100 | #98 | Exceptional $64,142 |
| Assyrians/Chaldeans/Syriacs | 96.4 /100 | #99 | Exceptional $64,108 |
| Immigrants | South Eastern Asia | 96.3 /100 | #100 | Exceptional $64,089 |
| Immigrants | Italy | 96.2 /100 | #101 | Exceptional $64,065 |
| Chileans | 95.8 /100 | #102 | Exceptional $63,957 |