Navajo vs German Russian Householder Income Over 65 years
COMPARE
Navajo
German Russian
Householder Income Over 65 years
Householder Income Over 65 years Comparison
Navajo
German Russians
$47,722
HOUSEHOLDER INCOME OVER 65 YEARS
0.0/ 100
METRIC RATING
339th/ 347
METRIC RANK
$55,356
HOUSEHOLDER INCOME OVER 65 YEARS
0.3/ 100
METRIC RATING
256th/ 347
METRIC RANK
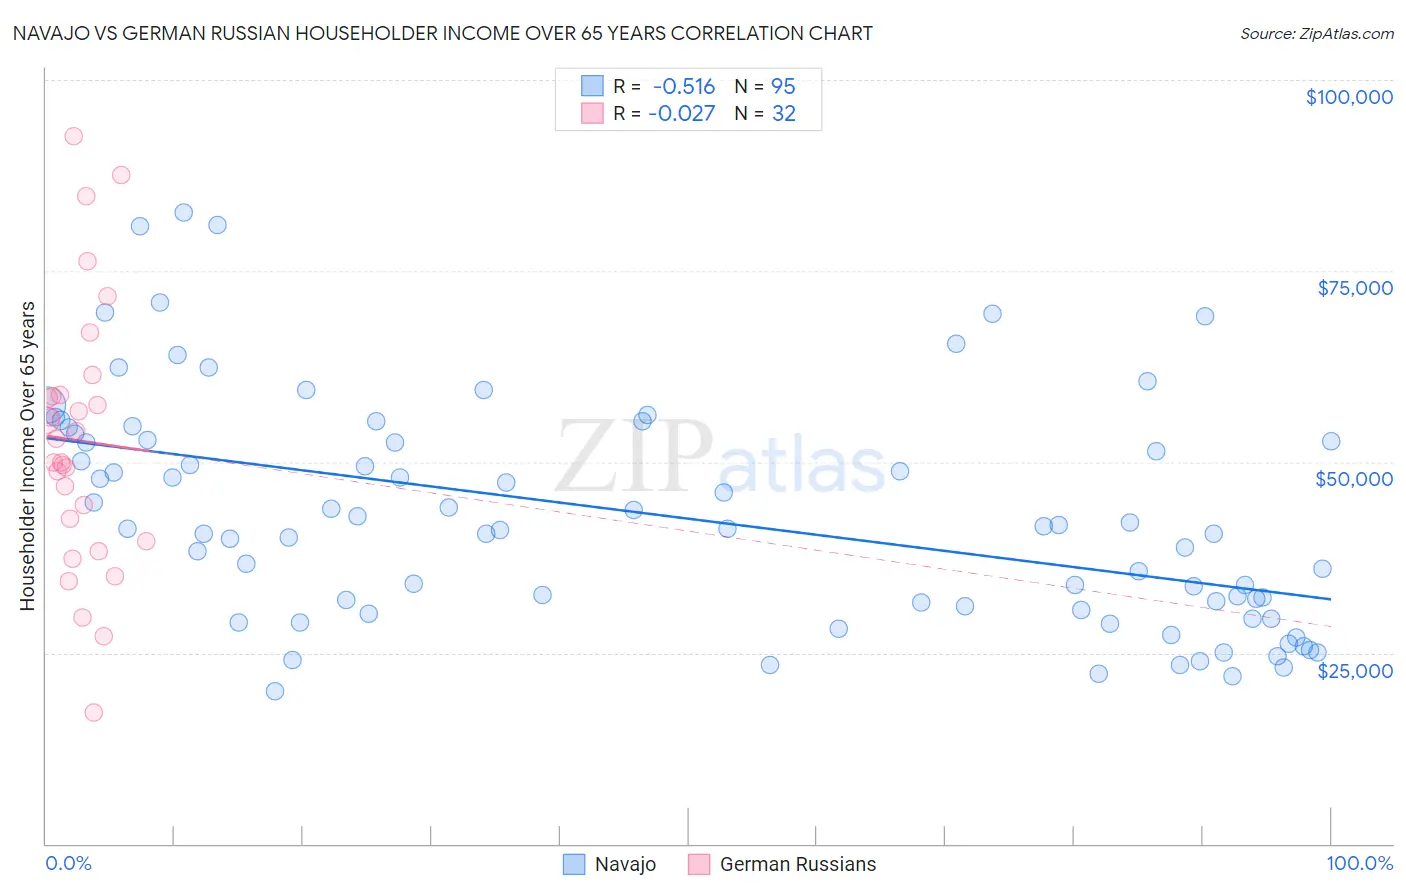
Navajo vs German Russian Householder Income Over 65 years Correlation Chart
The statistical analysis conducted on geographies consisting of 223,856,199 people shows a substantial negative correlation between the proportion of Navajo and household income with householder over the age of 65 in the United States with a correlation coefficient (R) of -0.516 and weighted average of $47,722. Similarly, the statistical analysis conducted on geographies consisting of 96,303,967 people shows no correlation between the proportion of German Russians and household income with householder over the age of 65 in the United States with a correlation coefficient (R) of -0.027 and weighted average of $55,356, a difference of 16.0%.
Householder Income Over 65 years Correlation Summary
| Measurement | Navajo | German Russian |
| Minimum | $20,040 | $17,222 |
| Maximum | $82,574 | $92,589 |
| Range | $62,535 | $75,367 |
| Mean | $42,837 | $52,783 |
| Median | $41,250 | $51,516 |
| Interquartile 25% (IQ1) | $30,625 | $41,107 |
| Interquartile 75% (IQ3) | $52,850 | $58,681 |
| Interquartile Range (IQR) | $22,225 | $17,574 |
| Standard Deviation (Sample) | $14,837 | $17,181 |
| Standard Deviation (Population) | $14,759 | $16,911 |
Similar Demographics by Householder Income Over 65 years
Demographics Similar to Navajo by Householder Income Over 65 years
In terms of householder income over 65 years, the demographic groups most similar to Navajo are Immigrants from Yemen ($47,527, a difference of 0.41%), Dominican ($46,964, a difference of 1.6%), Immigrants from Caribbean ($48,535, a difference of 1.7%), Immigrants from Cabo Verde ($46,654, a difference of 2.3%), and Tohono O'odham ($49,121, a difference of 2.9%).
| Demographics | Rating | Rank | Householder Income Over 65 years |
| Dutch West Indians | 0.0 /100 | #332 | Tragic $50,475 |
| Cape Verdeans | 0.0 /100 | #333 | Tragic $50,077 |
| Immigrants | Dominica | 0.0 /100 | #334 | Tragic $50,071 |
| Crow | 0.0 /100 | #335 | Tragic $49,234 |
| Cubans | 0.0 /100 | #336 | Tragic $49,152 |
| Tohono O'odham | 0.0 /100 | #337 | Tragic $49,121 |
| Immigrants | Caribbean | 0.0 /100 | #338 | Tragic $48,535 |
| Navajo | 0.0 /100 | #339 | Tragic $47,722 |
| Immigrants | Yemen | 0.0 /100 | #340 | Tragic $47,527 |
| Dominicans | 0.0 /100 | #341 | Tragic $46,964 |
| Immigrants | Cabo Verde | 0.0 /100 | #342 | Tragic $46,654 |
| Immigrants | Dominican Republic | 0.0 /100 | #343 | Tragic $45,758 |
| Houma | 0.0 /100 | #344 | Tragic $44,822 |
| Immigrants | Cuba | 0.0 /100 | #345 | Tragic $44,735 |
| Puerto Ricans | 0.0 /100 | #346 | Tragic $42,550 |
Demographics Similar to German Russians by Householder Income Over 65 years
In terms of householder income over 65 years, the demographic groups most similar to German Russians are Trinidadian and Tobagonian ($55,327, a difference of 0.050%), Immigrants from Bangladesh ($55,394, a difference of 0.070%), American ($55,527, a difference of 0.31%), Immigrants from Trinidad and Tobago ($55,598, a difference of 0.44%), and Osage ($55,677, a difference of 0.58%).
| Demographics | Rating | Rank | Householder Income Over 65 years |
| Mexican American Indians | 0.6 /100 | #249 | Tragic $56,089 |
| Immigrants | Bosnia and Herzegovina | 0.5 /100 | #250 | Tragic $55,986 |
| Immigrants | Portugal | 0.5 /100 | #251 | Tragic $55,924 |
| Osage | 0.4 /100 | #252 | Tragic $55,677 |
| Immigrants | Trinidad and Tobago | 0.4 /100 | #253 | Tragic $55,598 |
| Americans | 0.3 /100 | #254 | Tragic $55,527 |
| Immigrants | Bangladesh | 0.3 /100 | #255 | Tragic $55,394 |
| German Russians | 0.3 /100 | #256 | Tragic $55,356 |
| Trinidadians and Tobagonians | 0.3 /100 | #257 | Tragic $55,327 |
| Ecuadorians | 0.2 /100 | #258 | Tragic $54,958 |
| West Indians | 0.2 /100 | #259 | Tragic $54,936 |
| Immigrants | West Indies | 0.2 /100 | #260 | Tragic $54,927 |
| Comanche | 0.2 /100 | #261 | Tragic $54,922 |
| Bangladeshis | 0.1 /100 | #262 | Tragic $54,719 |
| French American Indians | 0.1 /100 | #263 | Tragic $54,699 |