Immigrants from Costa Rica vs German Russian Householder Income Over 65 years
COMPARE
Immigrants from Costa Rica
German Russian
Householder Income Over 65 years
Householder Income Over 65 years Comparison
Immigrants from Costa Rica
German Russians
$59,848
HOUSEHOLDER INCOME OVER 65 YEARS
23.6/ 100
METRIC RATING
193rd/ 347
METRIC RANK
$55,356
HOUSEHOLDER INCOME OVER 65 YEARS
0.3/ 100
METRIC RATING
256th/ 347
METRIC RANK
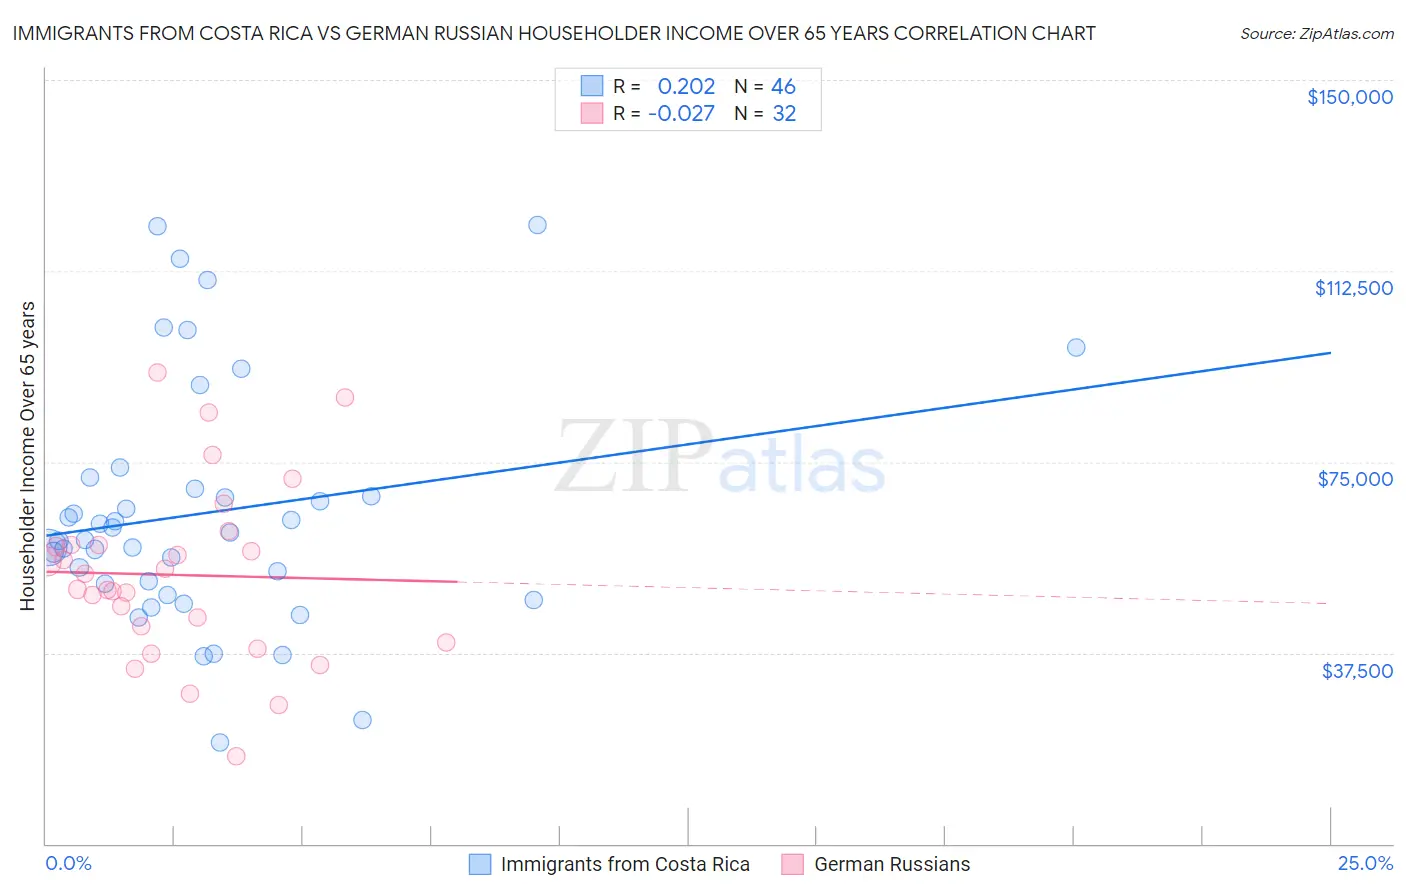
Immigrants from Costa Rica vs German Russian Householder Income Over 65 years Correlation Chart
The statistical analysis conducted on geographies consisting of 204,055,997 people shows a weak positive correlation between the proportion of Immigrants from Costa Rica and household income with householder over the age of 65 in the United States with a correlation coefficient (R) of 0.202 and weighted average of $59,848. Similarly, the statistical analysis conducted on geographies consisting of 96,303,967 people shows no correlation between the proportion of German Russians and household income with householder over the age of 65 in the United States with a correlation coefficient (R) of -0.027 and weighted average of $55,356, a difference of 8.1%.
Householder Income Over 65 years Correlation Summary
| Measurement | Immigrants from Costa Rica | German Russian |
| Minimum | $19,809 | $17,222 |
| Maximum | $121,538 | $92,589 |
| Range | $101,729 | $75,367 |
| Mean | $64,970 | $52,783 |
| Median | $60,382 | $51,516 |
| Interquartile 25% (IQ1) | $51,157 | $41,107 |
| Interquartile 75% (IQ3) | $69,698 | $58,681 |
| Interquartile Range (IQR) | $18,541 | $17,574 |
| Standard Deviation (Sample) | $23,728 | $17,181 |
| Standard Deviation (Population) | $23,468 | $16,911 |
Similar Demographics by Householder Income Over 65 years
Demographics Similar to Immigrants from Costa Rica by Householder Income Over 65 years
In terms of householder income over 65 years, the demographic groups most similar to Immigrants from Costa Rica are South American ($59,854, a difference of 0.010%), Immigrants from Africa ($59,837, a difference of 0.020%), Immigrants from Iraq ($59,824, a difference of 0.040%), Belgian ($59,915, a difference of 0.11%), and Puget Sound Salish ($59,934, a difference of 0.14%).
| Demographics | Rating | Rank | Householder Income Over 65 years |
| Slovenes | 31.8 /100 | #186 | Fair $60,241 |
| Immigrants | Thailand | 31.3 /100 | #187 | Fair $60,217 |
| Immigrants | Eritrea | 28.6 /100 | #188 | Fair $60,096 |
| Ghanaians | 27.5 /100 | #189 | Fair $60,043 |
| Puget Sound Salish | 25.3 /100 | #190 | Fair $59,934 |
| Belgians | 24.9 /100 | #191 | Fair $59,915 |
| South Americans | 23.8 /100 | #192 | Fair $59,854 |
| Immigrants | Costa Rica | 23.6 /100 | #193 | Fair $59,848 |
| Immigrants | Africa | 23.4 /100 | #194 | Fair $59,837 |
| Immigrants | Iraq | 23.2 /100 | #195 | Fair $59,824 |
| Germans | 21.5 /100 | #196 | Fair $59,730 |
| Immigrants | Kenya | 21.1 /100 | #197 | Fair $59,710 |
| Moroccans | 20.7 /100 | #198 | Fair $59,683 |
| Immigrants | Immigrants | 20.2 /100 | #199 | Fair $59,656 |
| French | 20.2 /100 | #200 | Fair $59,656 |
Demographics Similar to German Russians by Householder Income Over 65 years
In terms of householder income over 65 years, the demographic groups most similar to German Russians are Trinidadian and Tobagonian ($55,327, a difference of 0.050%), Immigrants from Bangladesh ($55,394, a difference of 0.070%), American ($55,527, a difference of 0.31%), Immigrants from Trinidad and Tobago ($55,598, a difference of 0.44%), and Osage ($55,677, a difference of 0.58%).
| Demographics | Rating | Rank | Householder Income Over 65 years |
| Mexican American Indians | 0.6 /100 | #249 | Tragic $56,089 |
| Immigrants | Bosnia and Herzegovina | 0.5 /100 | #250 | Tragic $55,986 |
| Immigrants | Portugal | 0.5 /100 | #251 | Tragic $55,924 |
| Osage | 0.4 /100 | #252 | Tragic $55,677 |
| Immigrants | Trinidad and Tobago | 0.4 /100 | #253 | Tragic $55,598 |
| Americans | 0.3 /100 | #254 | Tragic $55,527 |
| Immigrants | Bangladesh | 0.3 /100 | #255 | Tragic $55,394 |
| German Russians | 0.3 /100 | #256 | Tragic $55,356 |
| Trinidadians and Tobagonians | 0.3 /100 | #257 | Tragic $55,327 |
| Ecuadorians | 0.2 /100 | #258 | Tragic $54,958 |
| West Indians | 0.2 /100 | #259 | Tragic $54,936 |
| Immigrants | West Indies | 0.2 /100 | #260 | Tragic $54,927 |
| Comanche | 0.2 /100 | #261 | Tragic $54,922 |
| Bangladeshis | 0.1 /100 | #262 | Tragic $54,719 |
| French American Indians | 0.1 /100 | #263 | Tragic $54,699 |