Immigrants from Singapore vs Immigrants from Albania Wage/Income Gap
COMPARE
Immigrants from Singapore
Immigrants from Albania
Wage/Income Gap
Wage/Income Gap Comparison
Immigrants from Singapore
Immigrants from Albania
28.9%
WAGE/INCOME GAP
0.1/ 100
METRIC RATING
322nd/ 347
METRIC RANK
24.0%
WAGE/INCOME GAP
98.4/ 100
METRIC RATING
108th/ 347
METRIC RANK
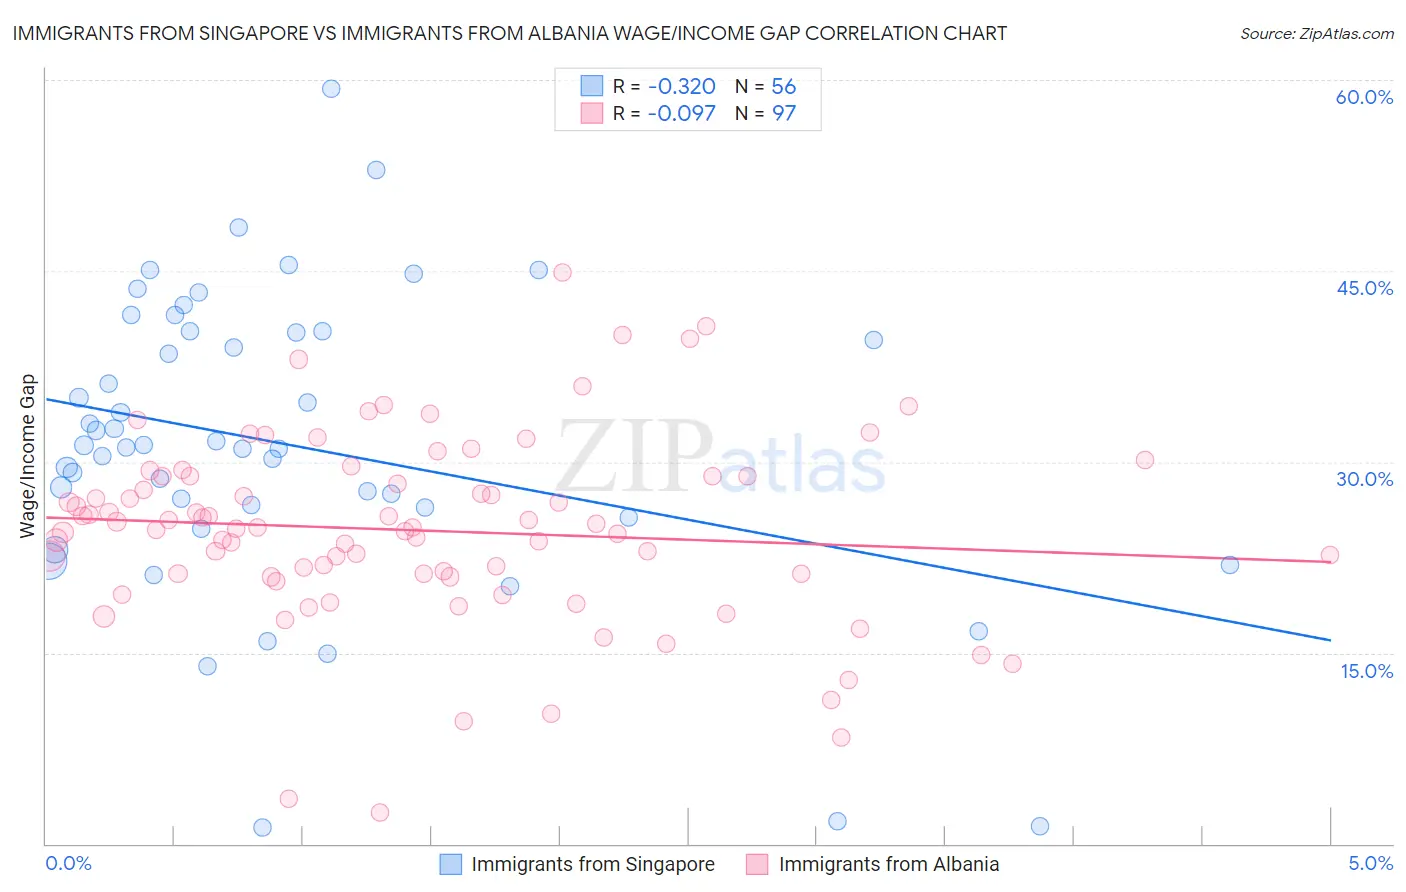
Immigrants from Singapore vs Immigrants from Albania Wage/Income Gap Correlation Chart
The statistical analysis conducted on geographies consisting of 137,510,142 people shows a mild negative correlation between the proportion of Immigrants from Singapore and wage/income gap percentage in the United States with a correlation coefficient (R) of -0.320 and weighted average of 28.9%. Similarly, the statistical analysis conducted on geographies consisting of 119,353,518 people shows a slight negative correlation between the proportion of Immigrants from Albania and wage/income gap percentage in the United States with a correlation coefficient (R) of -0.097 and weighted average of 24.0%, a difference of 20.3%.
Wage/Income Gap Correlation Summary
| Measurement | Immigrants from Singapore | Immigrants from Albania |
| Minimum | 1.3% | 2.5% |
| Maximum | 59.3% | 44.9% |
| Range | 58.0% | 42.4% |
| Mean | 31.3% | 24.6% |
| Median | 31.2% | 24.8% |
| Interquartile 25% (IQ1) | 26.0% | 21.1% |
| Interquartile 75% (IQ3) | 40.2% | 28.8% |
| Interquartile Range (IQR) | 14.2% | 7.8% |
| Standard Deviation (Sample) | 11.9% | 7.4% |
| Standard Deviation (Population) | 11.8% | 7.4% |
Similar Demographics by Wage/Income Gap
Demographics Similar to Immigrants from Singapore by Wage/Income Gap
In terms of wage/income gap, the demographic groups most similar to Immigrants from Singapore are Welsh (28.9%, a difference of 0.020%), British (28.9%, a difference of 0.080%), Norwegian (29.0%, a difference of 0.11%), Slovak (28.9%, a difference of 0.15%), and Croatian (29.0%, a difference of 0.23%).
| Demographics | Rating | Rank | Wage/Income Gap |
| Maltese | 0.1 /100 | #315 | Tragic 28.7% |
| Lithuanians | 0.1 /100 | #316 | Tragic 28.7% |
| Belgians | 0.1 /100 | #317 | Tragic 28.8% |
| Basques | 0.1 /100 | #318 | Tragic 28.8% |
| Slovaks | 0.1 /100 | #319 | Tragic 28.9% |
| British | 0.1 /100 | #320 | Tragic 28.9% |
| Welsh | 0.1 /100 | #321 | Tragic 28.9% |
| Immigrants | Singapore | 0.1 /100 | #322 | Tragic 28.9% |
| Norwegians | 0.1 /100 | #323 | Tragic 29.0% |
| Croatians | 0.0 /100 | #324 | Tragic 29.0% |
| Hungarians | 0.0 /100 | #325 | Tragic 29.0% |
| Immigrants | Belgium | 0.0 /100 | #326 | Tragic 29.0% |
| Immigrants | Iran | 0.0 /100 | #327 | Tragic 29.1% |
| Scandinavians | 0.0 /100 | #328 | Tragic 29.1% |
| Scottish | 0.0 /100 | #329 | Tragic 29.1% |
Demographics Similar to Immigrants from Albania by Wage/Income Gap
In terms of wage/income gap, the demographic groups most similar to Immigrants from Albania are Yaqui (24.0%, a difference of 0.0%), Ugandan (24.1%, a difference of 0.060%), Immigrants from Morocco (24.1%, a difference of 0.27%), Moroccan (24.0%, a difference of 0.31%), and Sudanese (24.0%, a difference of 0.31%).
| Demographics | Rating | Rank | Wage/Income Gap |
| Japanese | 99.1 /100 | #101 | Exceptional 23.8% |
| Immigrants | Laos | 99.0 /100 | #102 | Exceptional 23.8% |
| Tsimshian | 98.9 /100 | #103 | Exceptional 23.9% |
| Tlingit-Haida | 98.7 /100 | #104 | Exceptional 24.0% |
| Moroccans | 98.6 /100 | #105 | Exceptional 24.0% |
| Sudanese | 98.6 /100 | #106 | Exceptional 24.0% |
| Yaqui | 98.4 /100 | #107 | Exceptional 24.0% |
| Immigrants | Albania | 98.4 /100 | #108 | Exceptional 24.0% |
| Ugandans | 98.3 /100 | #109 | Exceptional 24.1% |
| Immigrants | Morocco | 98.1 /100 | #110 | Exceptional 24.1% |
| Soviet Union | 97.6 /100 | #111 | Exceptional 24.2% |
| Immigrants | Colombia | 97.0 /100 | #112 | Exceptional 24.3% |
| Sioux | 96.9 /100 | #113 | Exceptional 24.3% |
| Panamanians | 96.5 /100 | #114 | Exceptional 24.4% |
| Immigrants | Kenya | 96.4 /100 | #115 | Exceptional 24.4% |