Immigrants from Sierra Leone vs Bermudan Householder Income Ages 25 - 44 years
COMPARE
Immigrants from Sierra Leone
Bermudan
Householder Income Ages 25 - 44 years
Householder Income Ages 25 - 44 years Comparison
Immigrants from Sierra Leone
Bermudans
$93,115
HOUSEHOLDER INCOME AGES 25 - 44 YEARS
30.9/ 100
METRIC RATING
188th/ 347
METRIC RANK
$88,231
HOUSEHOLDER INCOME AGES 25 - 44 YEARS
2.9/ 100
METRIC RATING
235th/ 347
METRIC RANK
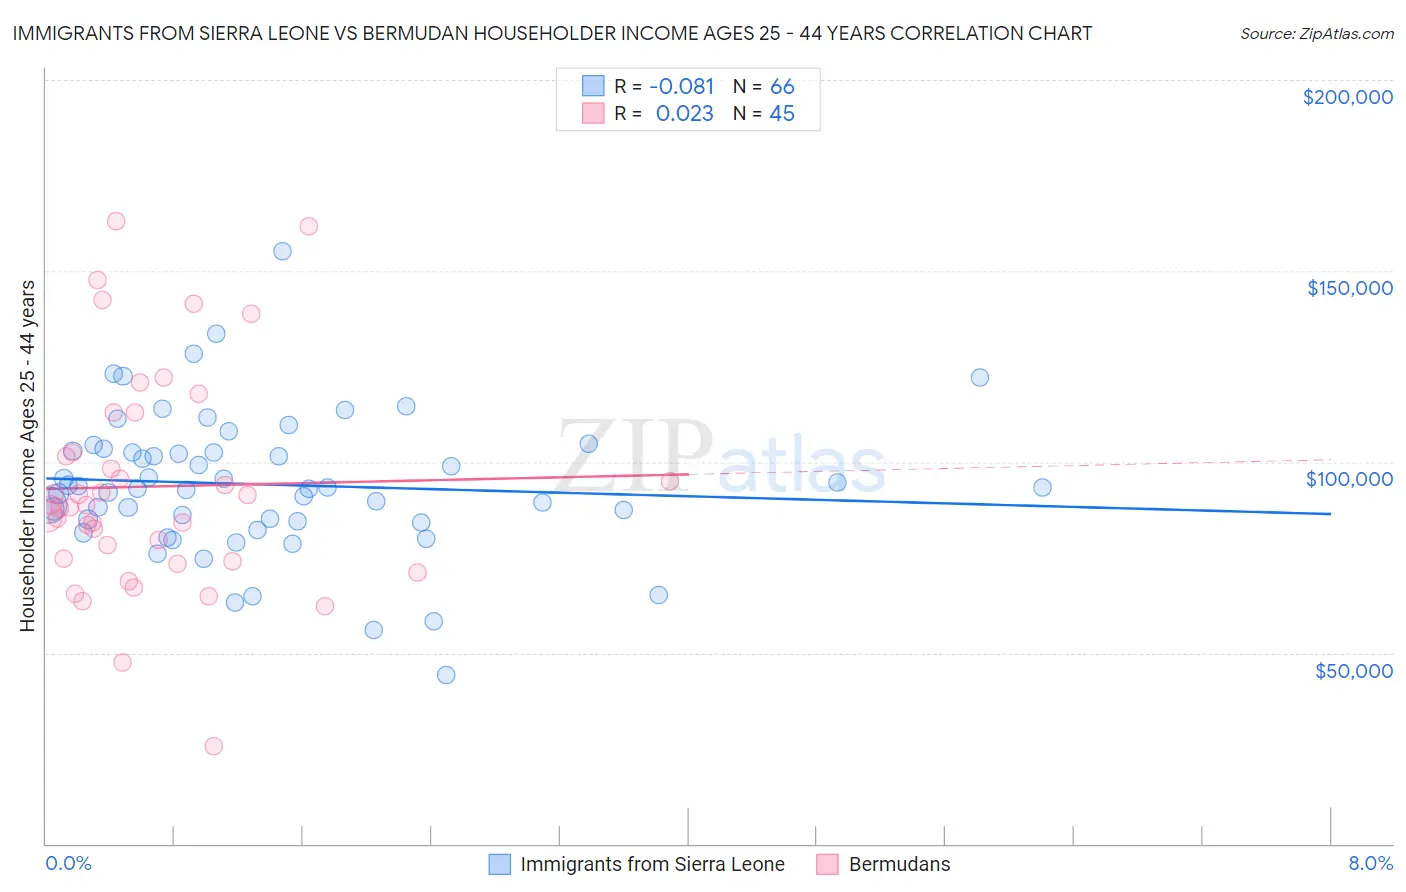
Immigrants from Sierra Leone vs Bermudan Householder Income Ages 25 - 44 years Correlation Chart
The statistical analysis conducted on geographies consisting of 101,610,295 people shows a slight negative correlation between the proportion of Immigrants from Sierra Leone and household income with householder between the ages 25 and 44 in the United States with a correlation coefficient (R) of -0.081 and weighted average of $93,115. Similarly, the statistical analysis conducted on geographies consisting of 55,699,004 people shows no correlation between the proportion of Bermudans and household income with householder between the ages 25 and 44 in the United States with a correlation coefficient (R) of 0.023 and weighted average of $88,231, a difference of 5.5%.
Householder Income Ages 25 - 44 years Correlation Summary
| Measurement | Immigrants from Sierra Leone | Bermudan |
| Minimum | $44,243 | $25,615 |
| Maximum | $155,156 | $163,159 |
| Range | $110,913 | $137,544 |
| Mean | $94,051 | $93,543 |
| Median | $93,126 | $88,641 |
| Interquartile 25% (IQ1) | $84,614 | $74,251 |
| Interquartile 75% (IQ3) | $102,869 | $107,790 |
| Interquartile Range (IQR) | $18,254 | $33,539 |
| Standard Deviation (Sample) | $18,629 | $28,803 |
| Standard Deviation (Population) | $18,487 | $28,481 |
Similar Demographics by Householder Income Ages 25 - 44 years
Demographics Similar to Immigrants from Sierra Leone by Householder Income Ages 25 - 44 years
In terms of householder income ages 25 - 44 years, the demographic groups most similar to Immigrants from Sierra Leone are Dutch ($93,081, a difference of 0.040%), Welsh ($93,039, a difference of 0.080%), Tlingit-Haida ($92,987, a difference of 0.14%), Immigrants from Costa Rica ($92,876, a difference of 0.26%), and Spaniard ($93,366, a difference of 0.27%).
| Demographics | Rating | Rank | Householder Income Ages 25 - 44 years |
| Puget Sound Salish | 37.7 /100 | #181 | Fair $93,661 |
| Uruguayans | 37.3 /100 | #182 | Fair $93,631 |
| Guamanians/Chamorros | 36.5 /100 | #183 | Fair $93,569 |
| Germans | 36.0 /100 | #184 | Fair $93,531 |
| Immigrants | Eritrea | 35.2 /100 | #185 | Fair $93,466 |
| Sierra Leoneans | 34.8 /100 | #186 | Fair $93,435 |
| Spaniards | 34.0 /100 | #187 | Fair $93,366 |
| Immigrants | Sierra Leone | 30.9 /100 | #188 | Fair $93,115 |
| Dutch | 30.5 /100 | #189 | Fair $93,081 |
| Welsh | 30.0 /100 | #190 | Fair $93,039 |
| Tlingit-Haida | 29.4 /100 | #191 | Fair $92,987 |
| Immigrants | Costa Rica | 28.2 /100 | #192 | Fair $92,876 |
| Samoans | 23.0 /100 | #193 | Fair $92,385 |
| Immigrants | Azores | 22.4 /100 | #194 | Fair $92,322 |
| Celtics | 21.6 /100 | #195 | Fair $92,241 |
Demographics Similar to Bermudans by Householder Income Ages 25 - 44 years
In terms of householder income ages 25 - 44 years, the demographic groups most similar to Bermudans are Venezuelan ($88,232, a difference of 0.0%), Immigrants from Cameroon ($88,214, a difference of 0.020%), Salvadoran ($88,198, a difference of 0.040%), Malaysian ($88,291, a difference of 0.070%), and Nonimmigrants ($88,301, a difference of 0.080%).
| Demographics | Rating | Rank | Householder Income Ages 25 - 44 years |
| Immigrants | Bosnia and Herzegovina | 4.0 /100 | #228 | Tragic $88,819 |
| Immigrants | Barbados | 3.7 /100 | #229 | Tragic $88,687 |
| Alaskan Athabascans | 3.3 /100 | #230 | Tragic $88,446 |
| Immigrants | Grenada | 3.0 /100 | #231 | Tragic $88,311 |
| Immigrants | Nonimmigrants | 3.0 /100 | #232 | Tragic $88,301 |
| Malaysians | 3.0 /100 | #233 | Tragic $88,291 |
| Venezuelans | 2.9 /100 | #234 | Tragic $88,232 |
| Bermudans | 2.9 /100 | #235 | Tragic $88,231 |
| Immigrants | Cameroon | 2.9 /100 | #236 | Tragic $88,214 |
| Salvadorans | 2.8 /100 | #237 | Tragic $88,198 |
| Alaska Natives | 2.6 /100 | #238 | Tragic $88,018 |
| Immigrants | Ghana | 2.2 /100 | #239 | Tragic $87,760 |
| Nicaraguans | 2.2 /100 | #240 | Tragic $87,751 |
| Nigerians | 2.2 /100 | #241 | Tragic $87,730 |
| West Indians | 1.7 /100 | #242 | Tragic $87,205 |